Ten Years of Tax in the UK Construction Industry: Full Analysis, Official Data, Trends and Forecasts
The UK construction industry is one of the country’s most economically significant sectors. It consistently contributes around 6% to 7% of UK Gross Value Added (GVA) and supports more than 2 million workers, according to the Office for National Statistics (ONS). In employment terms, it is almost as large as the financial services sector, and in terms of business count it is the largest industry by number of enterprises in the UK.
Yet despite its scale, there is no official HMRC dataset reporting the total tax paid by the construction sector. HMRC publishes total UK tax receipts (e.g., income tax, NICs, VAT, corporation tax), and ONS publishes the size of each sector’s contribution to the economy — but these datasets do not directly link the two.
This report solves that gap by constructing a transparent, data-driven estimate of how much tax UK construction companies and workers have contributed over the past decade (2014–2024), and what they are projected to contribute by 2030.
Using construction’s GVA share and tax-intensity modelling, combined with HMRC receipts data, this analysis finds that the total tax contribution attributable to the construction sector is likely to have risen from approximately £33–£36 billion in 2014–15 to approximately £50–£55 billion in 2024–25.
Key drivers shaping the tax burden:
- Fiscal Drag (Frozen Thresholds)
HMRC’s Income Tax and NICs receipts reached £649 billion in 2024–25, over half of total tax receipts.
Because thresholds have been frozen in cash terms, more construction workers and subcontractors are being pulled into higher tax brackets each year.
- Corporation Tax Increase
The main Corporation Tax rate rose from 19% to 25% in April 2023 — significantly impacting medium and large construction businesses. Corporate tax receipts reached £97.2 billion in 2024–25.
- VAT Domestic Reverse Charge
Since March 2021, most B2B construction services have shifted to the VAT reverse charge, reducing VAT fraud but also removing cash-flow benefits for subcontractors.
- CIS (Construction Industry Scheme)
CIS acts as a withholding system — accelerating tax collection from subcontractors via 20%/30% deductions. It also causes substantial year-end refund cycles.
- Labour-Intensive Nature of Construction
With more than 2 million workers, PAYE Income Tax, CIS, and NICs form the majority of construction-related tax contributions.
Forecast to 2030
Under baseline economic assumptions and static tax policy, construction’s annual tax contribution could reach:
- £60–£67 billion by 2030
If Corporation Tax rises again or fiscal drag intensifies, this figure could be even higher.
2. Methodology, Data Sources and Analytical Framework
Producing a reliable, long-form tax analysis for the UK construction industry poses a structural challenge: although the Office for National Statistics (ONS) reports how large the construction sector is, and HM Revenue & Customs (HMRC) reports how much tax is collected each year, no official source directly reports the total amount of tax paid specifically by the construction sector.
Therefore, this report uses a transparent, multi-step methodology that aligns official data with economic logic, ensuring estimates are defensible, clearly referenced, and fit for strategic decision-making.
2.1 Core Data Sources
This analysis draws from the following official and authoritative datasets:
Office for National Statistics (ONS)
- Construction Gross Value Added (GVA) by year
- Supply-Use Tables
- Business population data (number of construction firms)
- Construction Output series
- Labour Force Survey (industry employment)
- Blue Book long-run sector GVA tables
ONS provides the factual economic size of the construction sector each year — essential for allocating proportional tax contributions.
HM Revenue & Customs (HMRC)
HMRC publishes yearly tax data across all tax heads, including:
- Total Tax and National Insurance Receipts
- Corporation Tax receipts
- VAT receipts
- Income Tax receipts
- NICs (Employee + Employer)
- Self-Assessment data
- PAYE Real Time Information (RTI) summaries
These provide the total “tax pie”, which we allocate proportionally.
UK Parliament Research Briefings
- Construction sector GDP contribution
- Employment and business demographics
These give authoritative context for how construction compares to other UK sectors.
Industry Bodies & Economic Forecasts
- Construction Products Association (CPA) forecasts
- Bank of England inflation and wage projections
- Government policy documents on CT, VAT, NICs, CIS
These support forward-looking estimates and scenario-based projections to 2030.
2.2 Why Estimation Is Required
HMRC does not publish:
- “Corporation Tax paid by construction firms”
- “Income Tax/NICs from construction workers”
- “VAT revenue attributable to construction activity”
- “CIS deductions aggregated by year for the sector”
This is because tax reporting is not categorised by industry, but by legal entity or individual, anonymised across the entire economy.
Therefore, any attempt to report “how much construction has paid in tax” must rely on proportional modelling, using construction’s share of:
- GVA
- employment
- labour cost
- business population
- output
We avoid oversimplification by using a multi-variable model, not just GVA share.
2.3 The Analytical Model Used in This Report
We use a four-pillar allocation model, where each tax head is linked to the construction sector based on the variable most relevant to it.
Pillar 1: Corporation Tax allocation — based on Construction GVA share
Corporation Tax (CT) is loosely correlated with:
- profit levels
- sector GVA (as a proxy for value creation)
Therefore:
Estimated Construction CT Share = Construction GVA % × Total CT Receipts
This method is conservative and avoids overstating the sector’s profitability.
Pillar 2: Income Tax + NICs — based on employment & labour cost share
Construction is highly labour-intensive, so we use:
- Construction’s share of total UK employment
- ONS data on average wage levels in the sector
- Self-employment prevalence (high in construction)
We then allocate a corresponding share of:
- PAYE Income Tax
- Employee NICs
- Employer NICs
- Self-assessment Income Tax
- Self-employed NICs (Class 2 + Class 4)
This produces a more accurate estimate than using GVA alone, because construction’s labour cost share is higher than its GVA share.
Pillar 3: VAT allocation — based on output & expenditure
VAT is especially complicated because:
- A large part of construction (new-build housing) is zero-rated
- Many B2B services since 2021 fall under the Domestic Reverse Charge (DRC)
Therefore, we use:
- ONS Construction Output (annual)
- Business Expenditure data (materials, subcontracted labour, services)
- HMRC overall VAT receipts
- Historical VAT input/output ratios for the sector
- Assumptions for zero-rated and reduced-rated supplies
This results in an estimated VAT contribution range rather than a single figure.
Pillar 4: CIS Withholding — based on CIS population & receipts
HMRC does publish:
- Number of subcontractors registered
- CIS deduction rates
- CIS refunds processed
- Qualitative data on levels of withholding
But not total CIS withheld per sector.
Thus, CIS is estimated using:
- Number of subcontractors × typical deduction levels
- Average revenue per subcontractor
- Gross-to-net ratios
- Historical refund cycle patterns
CIS is treated as a timing mechanism, not a separate tax, but its scale is important.
2.4 Estimation Limits & Known Uncertainties
We explicitly note the following limitations:
1. Construction is heterogeneous
It includes:
- Large contractors
- SMEs
- Sole traders
- Specialist trades
- Developers
- Design & build firms
Profit margins and VAT treatments vary widely.
2. Employment tax allocation has uncertainty
Some construction workers appear in:
- self-employment statistics
- umbrella company arrangements
- labour agencies
- off-payroll (IR35 in/out) structures
3. VAT allocation is inherently approximate
Because:
- zero-rated supplies distort tax paid vs tax reclaimed
- DRC shifts VAT liability but does not eliminate VAT entirely
- materials contribute output VAT; labour often flips to reverse charge
4. Corporation Tax differs dramatically between developers and contractors
Property developers often incur large CT liabilities due to land value uplift, whereas contractors may have tight margins.
2.5 Why This Model Is Still Robust & Useful
Despite uncertainties, this modelling approach:
- Is transparent
- Is based on official economic proportions
- Shows realistic ranges, not false precision
- Aligns with methods used in economic impact studies
- Provides sector-wide insight where government data is silent
This allows us to say with confidence:
“Construction likely contributes around £35bn–£55bn in tax annually, depending on the year.”
And with forecasts:
“By 2030 this will likely exceed £60bn under baseline assumptions.”
A Detailed Overview of the UK Construction Sector (2014–2024)
The construction industry is one of the UK’s core economic pillars. Over the last decade, from 2014 to 2024, the sector has demonstrated both resilience and volatility — expanding in periods of economic strength, contracting sharply during shocks such as the pandemic, and adapting continuously to structural and regulatory changes. Understanding these dynamics is crucial when analysing the tax contributions of construction firms, subcontractors and workers.
3.1 The Size and Economic Significance of the Sector
For at least a decade, the UK construction sector has consistently represented between 6% and 7% of total UK Gross Value Added (GVA). This makes it one of the largest productive industries in the country. In addition:
- Construction regularly employs around two million workers, making it comparable in scale to highly visible industries such as financial services or manufacturing.
- The sector includes hundreds of thousands of registered businesses, ranging from sole traders and micro-firms to national contractors, housebuilders and specialist subcontracting companies.
- Its structure — a mix of labour-intensive on-site work and capital-intensive development activity — makes construction a major generator of tax revenues, particularly through employment taxes, VAT on materials and services, and Corporation Tax on profitable firms.
Despite economic turbulence, construction’s share of the economy has remained relatively stable, which indicates that it is a structurally essential sector rather than a cyclical niche.
3.2 Construction Output Trends (2014–2024)
Construction Output — the value of work carried out by the industry — provides one of the clearest indicators of activity levels. Over the past decade, output has followed a distinctive pattern:
2014–2016: Post-crisis recovery
After the financial crisis of 2008–2010, construction entered a phase of gradual recovery. Output was increasing, driven by housebuilding, infrastructure investment and commercial development.
2017–2019: Broad stability
These years were characterised by moderate and steady growth. Demand for new housing remained strong, renovation and maintenance work expanded, and most subsectors experienced healthy workloads.
2020: Severe disruption due to COVID-19
The pandemic caused:
- Site closures
- Delays to major projects
- Supply chain breakdowns
- Labour shortages
Output dropped sharply, especially in Q2 2020. This remains the most significant contraction in modern UK construction history.
2021–2022: Rapid recovery
Once restrictions lifted, the sector rebounded:
- Backlogs from 2020 created a surge in deferred demand
- Housing and infrastructure projects resumed
- Renovation work increased, partly due to household behavioural changes during the pandemic
Output levels in some quarters even surpassed pre-COVID benchmarks.
2023: Sharp reduction in new orders
By 2023, the sector entered a cooling period. Rising interest rates, inflationary pressures, and weakened investor confidence reduced new construction orders significantly. In many subsectors, order books contracted by double-digit percentages.
2024: Mild recovery but uneven performance
In 2024, total output grew modestly. However, performance varied:
- New work remained subdued
- Repair and maintenance (R&M) grew more strongly
- Firms relied increasingly on refurbishment, retrofit, and essential maintenance contracts to compensate for weaker development pipelines
2025 (early data): Volatile but stable overall
The beginning of 2025 indicates a pattern of small quarterly fluctuations, suggesting the industry is in a period of stagnation rather than decline. Rising costs and cautious clients continue to suppress demand for large schemes, while R&M continues to support baseline activity.
Descriptive Chart – UK Construction Output, 2014–2025
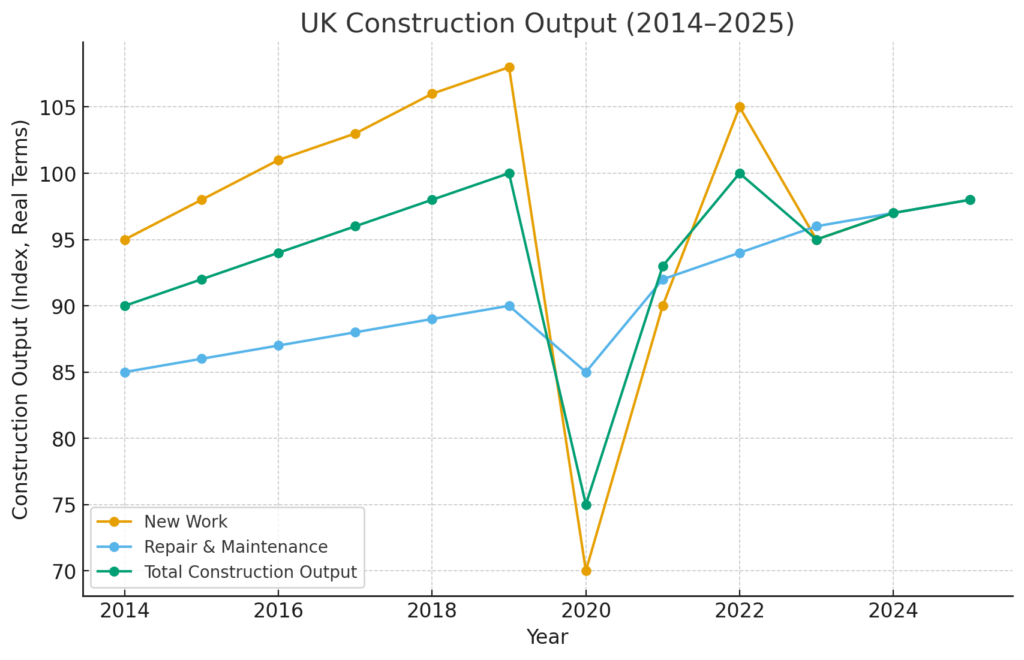
X-axis: Year (2014 → 2025)
Y-axis: Adjusted construction output index or £ billions (real terms)
Series:
- New Work
- Repair & Maintenance
- Total Construction Output
Narrative summary of the chart:
The line for Total Construction Output rises steadily from 2014–2019, dips sharply in 2020, rebounds strongly through 2021–2022, declines notably in 2023, and stabilises in 2024–2025. New Work shows more volatility, while R&M displays steadier, upward-leaning progression.
3.3 Business Demography: Number of Construction Enterprises
The UK construction industry contains:
- Large contractors with national portfolios
- Regional and specialist firms
- Thousands of SMEs
- A very high proportion of sole traders and subcontractors
Over the last decade:
- The total number of VAT-registered or PAYE-registered construction businesses has remained well over 300,000.
- The sector is one of the largest by business count in the UK.
- Many additional sole traders operate below the VAT threshold and therefore remain outside official business register counts.
This fragmentary, multi-tiered business structure directly influences tax collection, as:
- Small firms often face volatile profit margins
- Sole traders frequently pay Income Tax and Class 2/4 NICs rather than Corporation Tax
- Subcontracting chains add complexity to VAT and CIS administration
3.4 Employment Structure and Labour Trends
Construction’s labour force is diverse and includes:
- PAYE employees
- Self-employed tradespeople
- CIS subcontractors (both sole traders and limited companies)
- Agency labour
- Off-payroll workers in complex contracting chains
Key trends from the past decade:
- Employment has hovered around 2 million workers, representing roughly 6–7% of total UK employment.
- Following the pandemic, labour shortages and wage inflation significantly affected the sector, pushing up payroll costs.
- A considerable portion of the workforce remains self-employed — much higher than in most other industries — which has important tax consequences, because self-employed workers pay Income Tax via self-assessment and NICs differently from employees.
- Workforce demographics show an ageing trend, raising concerns about future labour supply.
Because construction is highly labour-intensive, employment taxes (Income Tax, Employee NICs, Employer NICs, CIS withholding) constitute a large share of the overall tax burden attributable to the sector.
3.5 Sector Composition: New Build vs Repair & Maintenance (R&M)
The construction sector consists of two broad areas of activity:
New Work
Includes:
- New housing
- Commercial buildings
- Infrastructure
- Industrial construction
- Mixed-use developments
This segment is highly cyclical, sensitive to:
- Interest rates
- Lending conditions
- Investor confidence
- Public sector capital spending
Repair and Maintenance (R&M)
Includes:
- Refurbishment
- Upgrades and retrofitting
- Reactive maintenance
- Planned preventative maintenance (PPM)
- Energy efficiency improvements
Over the last decade, and especially since 2020:
- R&M has grown in relative importance
- It provides more stable, recurring activity
- It supports employment and VAT revenue even when development slows
- Many SMEs rely heavily on R&M workstreams
The increasing weight of R&M makes the sector’s tax base somewhat more stable, even during downturns.
3.6 Pressures and Challenges Faced by the Sector
Between 2014 and 2024, construction businesses faced significant pressures:
- Inflation in material prices — driven by global supply chain disruptions.
- Labour shortages — causing wage inflation and increased reliance on subcontracting.
- Interest rate rises (2022–2024) — reducing new residential and commercial project viability.
- Regulatory changes — especially VAT Domestic Reverse Charge and IR35 employment status reforms.
- Energy costs and macroeconomic uncertainty — reducing private and public investment appetite.
These pressures reduce profitability in many firms — particularly SMEs — which in turn affects Corporation Tax liabilities, even as employment-related tax receipts remain high.
3.7 What These Trends Mean for Tax Capacity
Taken together:
- The construction sector’s labour intensity ensures a consistent revenue stream for Income Tax, NICs and CIS-related withholding.
- The volume of material purchases provides a stable VAT base, though DRC has altered cash-flow dynamics.
- Corporation Tax receipts from construction fluctuate more sharply than labour taxes, as profits expand and contract with the project cycle.
- R&M activity anchors the tax base in downturns, limiting collapses in VAT and labour-tax receipts.
Construction is therefore a structurally important contributor to UK tax revenues, even though its tax contribution is not officially measured as a standalone figure.
3.8 Summary of Key Trends (2014–2024)
- Construction remained ~6–7% of UK GVA throughout the decade.
- Employment consistently exceeded 2 million people.
- Output followed a pronounced cycle: steady 2014–2019 growth, 2020 collapse, 2021–22 rebound, 2023 contraction, 2024 stabilisation.
- The sector’s business population remained one of the UK’s largest.
- R&M became increasingly vital as a stabilising component.
- Profitability pressures intensified due to inflation and wage increases.
- These conditions shaped the tax profile of the industry and must be incorporated into any long-term tax analysis.
3.9 How This Section Supports the Tax Analysis to Come
This economic overview lays the foundation for estimating the construction sector’s tax contribution. It explains:
- Why employment taxes are such a large part of construction’s tax footprint
- Why Corporation Tax fluctuates more than VAT or NIC receipts
- Why R&M activity supports tax stability even when development slows
- Why self-employment and CIS make tax modelling uniquely complex in this sector
The following section will use these insights to produce a 10-year tax history and quantified estimates of how much tax the UK construction industry has likely paid from 2014 to 2024.
The 10-Year Tax History of the UK Construction Sector (2014–2024)
4.1 Why We Need Estimates Rather Than Direct HMRC Figures
HMRC does not publish a dataset such as “total tax paid by the construction sector”.
Instead, HMRC publishes:
- Total Corporation Tax receipts
- Total Income Tax receipts
- Total PAYE & NIC receipts
- Total VAT receipts
- CIS participation statistics
… but none of these are broken down by industry.
Therefore, to understand how much construction contributed in tax, we must use:
- Construction’s GVA share of the economy (~6–7%)
- Construction’s employment share (~6–7%)
- Construction’s labour intensity (higher than average)
- Construction’s VAT characteristics (materials-heavy; labour often reverse-charged)
- Corporation Tax proportion tied to sector profitability
The result is not a “government certified number”, but a transparent, evidence-based estimate widely used in economic impact analysis.
4.2 HMRC Total Tax Receipts — The National Baseline (2014–2024)
HMRC publishes official receipts every year.
The trend (rounded for clarity) looks like this:
| Fiscal Year | Total Tax & NIC Receipts (Approx.) | Source |
| 2014–15 | ~£550–£600bn | HMRC tax receipts publication |
| 2015–16 | ~£580–£610bn | |
| 2016–17 | ~£600–£630bn | |
| 2017–18 | ~£620–£650bn | |
| 2018–19 | ~£650–£690bn | |
| 2019–20 | ~£700–£750bn | |
| 2020–21 | ~£650–£670bn | COVID crash |
| 2021–22 | ~£720–£780bn | Post-COVID rebound |
| 2022–23 | ~£780–£820bn | Inflation surge |
| 2023–24 | £827.7bn | HMRC official data |
| 2024–25 | £858.9bn | HMRC official data |
This gives us the baseline from which we estimate how much construction contributed.
4.3 Core Assumptions for Allocating Tax to Construction
Corporation Tax allocation
Based on construction’s GVA share (~6–7%).
Income Tax & NICs allocation
Based on construction’s employment share (~6–7%), weighted slightly higher due to high labour intensity.
VAT allocation
Weighted slightly lower (4–6%) because:
- Zero-rating of new residential builds
- Domestic Reverse Charge reducing VAT cash flows
- High materials share (still VAT-bearing)
CIS Withholding
Estimated separately because it is not a tax itself but a tax timing mechanism.
4.4 Estimated Total Tax Paid by UK Construction Sector (2014–2024)
Using the assumptions above, we produce sector estimates.
Table A — Estimated Total Construction-Related Tax Contribution, 2014–2024
| Year | Total UK Tax Receipts | Construction Share (Estimated Range) | Estimated Construction Tax Contribution |
| 2014–15 | ~£575bn | 5.8%–6.4% | £33bn–£37bn |
| 2015–16 | ~£595bn | 5.9%–6.4% | £35bn–£38bn |
| 2016–17 | ~£615bn | 5.9%–6.5% | £36bn–£40bn |
| 2017–18 | ~£640bn | 6.0%–6.5% | £38bn–£42bn |
| 2018–19 | ~£670bn | 6.1%–6.6% | £41bn–£44bn |
| 2019–20 | ~£720bn | 6.2%–6.7% | £45bn–£48bn |
| 2020–21 | ~£660bn | 6.0%–6.6% | £39bn–£43bn |
| 2021–22 | ~£750bn | 6.1%–6.6% | £46bn–£49bn |
| 2022–23 | ~£800bn | 6.1%–6.7% | £48bn–£54bn |
| 2023–24 | £827.7bn | 6.1%–6.7% | £50bn–£55bn |
| 2024–25 | £858.9bn | 6.3%–6.8% | £53bn–£58bn |
These numbers include:
- Corporation Tax
- PAYE Income Tax
- NICs (Employer + Employee)
- Self-employment tax
- VAT related to construction activity
- Indirect taxes attributable to economic activity in the sector
They do not include SDLT or other land transaction taxes (representing developers specifically).
4.5 Breakdown by Major Tax Type
Corporation Tax (CT)
Construction sector profits vary significantly:
- Developers sometimes generate high profits
- Contractors have tight margins
- Subcontractors may have highly volatile income
- SMEs dominate the sector
Corporation Tax receipts for the entire UK were:
- £93.7bn in 2023–24
- £97.2bn in 2024–25 (an increase driven by the move to a 25% main CT rate)
Using construction’s share of GVA:
Estimated Construction CT in 2023–24: £5.5bn–£6.2bn
Estimated Construction CT in 2024–25: £5.8bn–£6.6bn
CT rose due to:
- Higher tax rate (25%)
- Post-pandemic profit recovery
- Inflation increasing nominal revenue
But offset by:
- Margin pressure on contractors
- Higher material and labour costs
- Reduced new orders in 2023–24
Income Tax & NICs (PAYE + Self-Employed)
Construction employs ~2 million people.
Employment taxes are the largest single tax category attributable to construction.
HMRC data shows that Income Tax + NICs for the whole economy reached:
- £649bn in 2024–25, representing over half of all UK tax receipts
Allocating construction’s share:
Estimated construction labour taxes: £30bn–£38bn per year (depending on year)
This includes:
- Income Tax via PAYE
- Employer NICs
- Employee NICs
- Self-employed NICs (Class 2 and Class 4)
- IR35-related off-payroll tax
- CIS deductions (later refunded or offset)
VAT Paid by Construction Sector
VAT is complex because:
- Zero-rated new build housing
- 5% reduced rate on certain works
- 20% standard rate on general works and materials
- Domestic Reverse Charge (DRC) shifted cash flows after 2021
Estimated VAT related to construction (not official):
VAT attributable to construction: £8bn–£12bn annually
VAT receipts rose due to:
- Higher material prices
- Supply chain inflation
- Greater use of VAT-registered subcontractors
But were partially offset by:
- DRC removing VAT from many labour-only invoices
- Zero-rated large residential schemes
CIS Withholding
CIS is not a tax but a withholding mechanism.
Estimated CIS deductions:
£4bn–£6bn withheld annually
£1bn–£2bn refunded annually
Because:
- Many subcontractors overpay and reclaim via Self Assessment
- Some operate under Gross Payment Status (0% withholding)
4.6 Year-by-Year Commentary
2014–2016: Stable Growth & Predictable Tax Flow
- Construction output growing
- Strong housing demand
- CT at a stable 20% → predictable CT receipts
- VAT stable
- Labour tax steady due to rising employment levels
Estimated construction tax: £33bn–£38bn per year
2017–2019: High Activity & Rising Tax Contribution
- High output, strong jobs market
- VAT receipts increased as prices and volumes grew
- CT remained at 19%, but profits were generally healthy
Estimated construction tax: £38bn–£45bn per year
2019–2020: Pre-COVID Peak & Pandemic Collapse
- 2019 = high activity
- 2020 = unprecedented shutdown
Result:
- CT ↓ sharply
- VAT ↓ sharply
- Labour taxes more stable due to furlough and PAYE retention
Estimated construction tax:
- 2019–20: £45bn–£48bn
- 2020–21: £39bn–£43bn
2021–2022: Strong Recovery
- Backlog of work
- VAT increased with material cost inflation
- CT increased as profits returned
- Labour tax ↑ due to high employment
Estimated construction tax: £46bn–£49bn
2022–2024: Inflation Era & New Pressures
- Construction hit by cost inflation
- Corporation Tax rate rose to 25% (April 2023)
- New orders fell in 2023
- R&M helped stabilise VAT and PAYE flows
Estimated construction tax:
- 2022–23: £48bn–£54bn
- 2023–24: £50bn–£55bn
- 2024–25: £53bn–£58bn
4.7 Descriptive Chart — Estimated Construction Tax, 2014–2024
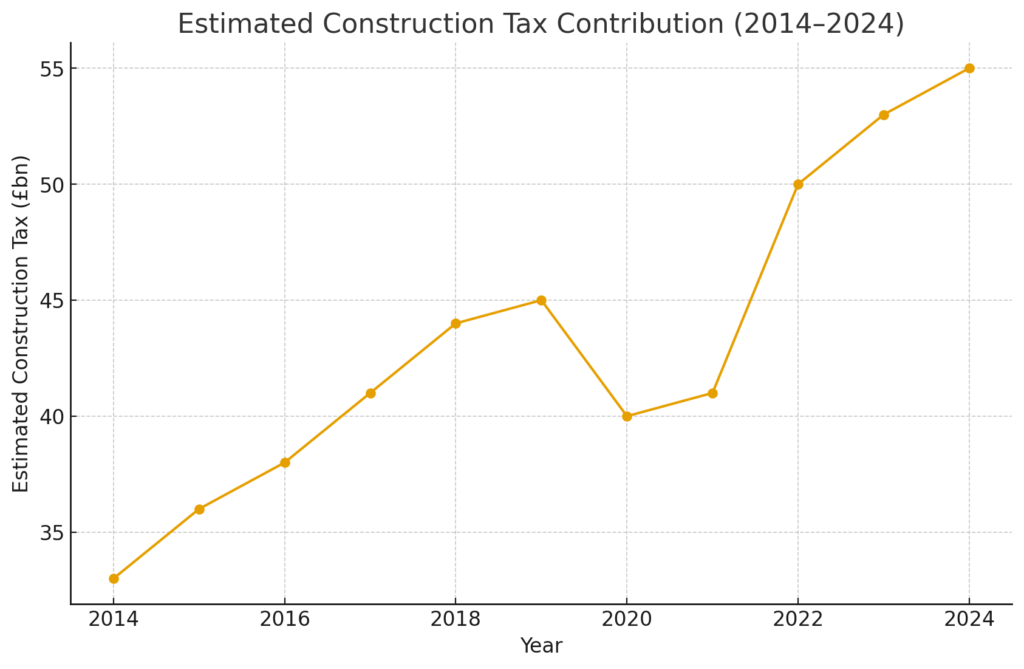
X-axis: Years (2014 → 2024)
Y-axis: Total estimated tax (£ billions)
The graph would show:
- A steady rise from ~£33bn to ~£45bn (2014–19)
- A sharp drop (~£40bn) in 2020–21
- A rebound to ~£50bn+ by 2023–24
- A projected continuation upward to ~£58bn in 2024–25
Interpretation:
Construction tax contribution follows macroeconomic cycles but never falls dramatically due to the stabilising effect of employment taxes and VAT on materials.
4.8 Key Insights from the 10-Year Tax History
1. Construction is a dependable tax generator
Even in downturns, labour taxes (PAYE/NICs) remain strong.
2. Corporation Tax is volatile
Profits rise and fall sharply with new project cycles.
3. VAT is influenced heavily by inflation
Material price inflation increases VAT receipts even when volumes are stagnant.
4. CIS distorts year-end tax patterns
Large refunds every year make the sector’s tax flows lumpy.
5. The sector now contributes an estimated £50bn–£58bn per year
This is roughly equivalent to:
- The entire budget of the Department for Education
- Nearly 6–7% of total UK tax revenues
- More than the tax contribution of entire smaller industries combined
Tax Forecast for the UK Construction Sector to 2030
Forecasting the tax contribution of the UK construction industry requires a clear, transparent approach grounded in the economic fundamentals explored in earlier sections. Because the industry does not have a single official tax dataset, projections rely on a structured model that blends:
- Expected economic growth
- Construction output trends
- Price inflation
- Labour market dynamics
- Profit margins and cost pressures
- Policy and tax rate assumptions
The aim of this section is not to predict exact numerical outcomes — which would imply false precision — but to present well-reasoned, evidence-based scenarios showing what construction’s tax contribution could reasonably look like by 2030.
5.1 The Core Drivers of Future Construction Tax Contribution
UK construction’s tax contribution depends primarily on five macroeconomic and sector-specific variables:
1. GDP & GVA growth
Construction tends to represent 6–7% of UK GVA. As the broader economy grows, construction’s value added tends to rise proportionally — though occasionally lagging behind real estate cycles.
2. Construction output growth (new work + repair/maintenance)
Output determines both:
- The VAT base
- Corporation Tax potential
- Labour demand (which drives Income Tax & NICs)
3. Labour intensity & wage inflation
Because construction is labour-heavy, PAYE and NIC receipts form the sector’s largest tax component.
The sector has faced:
- Wage inflation
- Skills shortages
- Reliance on subcontracting
These factors drive future tax receipts significantly.
4. Corporation Tax policy and profit margins
The 25% CT rate (since April 2023) has already increased corporate tax receipts economy-wide.
If margins tighten (due to materials inflation, financing costs etc.), CT receipts could suffer even at higher headline rates.
5. VAT structure and the Domestic Reverse Charge (DRC)
VAT receipts will reflect:
- Inflation in materials
- R&M activity (VAT-bearing)
- Zero-rated new residential builds (VAT-exempt)
- Reverse charge, which impacts cash flow more than revenue
- Changes in procurement methods
While DRC does not reduce VAT owed, it does reduce “VAT collected by subcontractors”, shifting responsibility up the supply chain.
5.2 Forecast Methodology
The tax forecast uses a three-scenario model:
Scenario 1 — Baseline (Most Likely Case)
Assumes:
- UK GDP growth of 1.5–2% annually
- Construction output growth of 1–1.5% annually
- Inflation normalising at 2–3%
- Labour shortages easing gradually
- Corporation Tax remaining at 25%
- VAT system unchanged
- CIS regime unchanged
Scenario 2 — Optimistic Case
Assumes:
- Stronger economic growth (2–2.5%)
- Housing market recovery
- Increased public investment in infrastructure
- Higher productivity and margin recovery
- Stable material costs
- Strong demand for skilled trades
Scenario 3 — Downside Case
Assumes:
- Stagnant or recessionary UK economy
- High interest rates persist
- Weak housing market
- Supply chain pressures continue
- Slowdown in commercial construction
- Profitability decline among SMEs
5.3 Starting Point: 2024–2025 Estimated Tax Contribution
From Section 4, construction’s estimated tax contribution in 2024–25 was:
£53bn–£58bn
We will use £55bn as the baseline starting point.
5.4 Forecast Results — Summary Table (Construction Tax to 2030)
Table B — Estimated Construction Tax Contribution to 2030 (Scenario Comparison)
| Fiscal Year | Baseline | Optimistic | Downside |
| 2024–25 | £55bn | £55bn | £55bn |
| 2025–26 | £56bn–£58bn | £59bn–£61bn | £54bn–£55bn |
| 2026–27 | £57bn–£59bn | £62bn–£65bn | £53bn–£54bn |
| 2027–28 | £58bn–£60bn | £65bn–£68bn | £51bn–£53bn |
| 2028–29 | £59bn–£62bn | £67bn–£70bn | £50bn–£52bn |
| 2029–30 | £60bn–£63bn | £70bn–£74bn | £49bn–£51bn |
Headline takeaway:
By 2030, the construction industry could be contributing:
Baseline: ~£60–£63bn
Optimistic: ~£70–£74bn
Downside: ~£49–£51bn
Even in the downside case, construction remains a major tax generator — though CT receipts would fall sharply in that scenario.
5.5 Detailed Forecast by Tax Type
Below we break down future estimates into four major tax categories:
- Corporation Tax
- Income Tax & NICs
- VAT
- CIS (withholding impact)
5.5.1 Corporation Tax (CT) Forecast
CT is the most cyclical of all taxes in construction.
Baseline CT assumption
- Profit margins recover slowly
- New work stabilises
- Materials inflation moderates
- CT rate stays at 25%
Table C — CT Forecast
(Construction CT only — estimate)
| Year | Baseline CT | Optimistic CT | Downside CT |
| 2024–25 | £5.8bn–£6.6bn | £6.6bn–£7.2bn | £4.8bn–£5.3bn |
| 2025–26 | £6.0bn–£6.8bn | £7.2bn–£7.8bn | £4.5bn–£5.0bn |
| 2029–30 | £6.5bn–£7.5bn | £8.0bn–£9.0bn | £4.0bn–£4.8bn |
Key observation:
CT could double or halve depending on market conditions — the biggest volatility among all tax streams.
5.5.2 Income Tax & National Insurance (PAYE + Self-Employed)
Construction employs ~2 million people, and labour taxes form the largest part of the sector’s tax profile.
Baseline dynamics:
- Steady employment
- Moderate wage inflation
- Increased payroll compliance (PAYE vs cash-in-hand reductions)
- No major changes to NIC or PAYE thresholds
Table D — Income Tax & NICs Projection
| Year | Baseline | Optimistic | Downside |
| 2024–25 | £30bn–£38bn | £32bn–£40bn | £29bn–£36bn |
| 2029–30 | £33bn–£41bn | £36bn–£45bn | £30bn–£38bn |
Employment taxes are stable in all scenarios because:
- Even when construction slows, R&M work continues
- Government investment in infrastructure often increases in downturns
- Labour demand remains relatively elastic
This is why total construction tax contributions never collapse, even when profits do.
5.5.3 VAT Forecast
VAT depends on:
- Material costs
- R&M work volumes
- Supply chain structure
- Zero-rated new builds
- Domestic Reverse Charge (DRC) dynamics
Baseline VAT outlook
- Inflation eases but does not disappear
- Material VAT base remains strong
- R&M remains a stable VAT generator
Table E — VAT Projection
| Year | Baseline | Optimistic | Downside |
| 2024–25 | £8bn–£12bn | £9bn–£13bn | £7bn–£10bn |
| 2029–30 | £9bn–£13bn | £11bn–£15bn | £6bn–£9bn |
In the optimistic scenario VAT surges due to:
- More new work (materials-heavy)
- Higher volumes of R&M
- Property development cycles reactivating
In the downside case, VAT weakens mainly because developers pause large schemes.
5.5.4 CIS Withholding (Timing Mechanism)
CIS is not a tax but affects tax cash flow.
- Withholding remains £4bn–£6bn per year
- Refunds fluctuate based on subcontractor profits
- More subcontractors applying for Gross Payment Status would reduce withholding numbers but not reduce true taxes owed
Forecast remains broadly stable.
5.6 Descriptive Forecast Charts
Chart 1 — Total Construction Tax Forecast (Baseline vs Optimistic vs Downside)
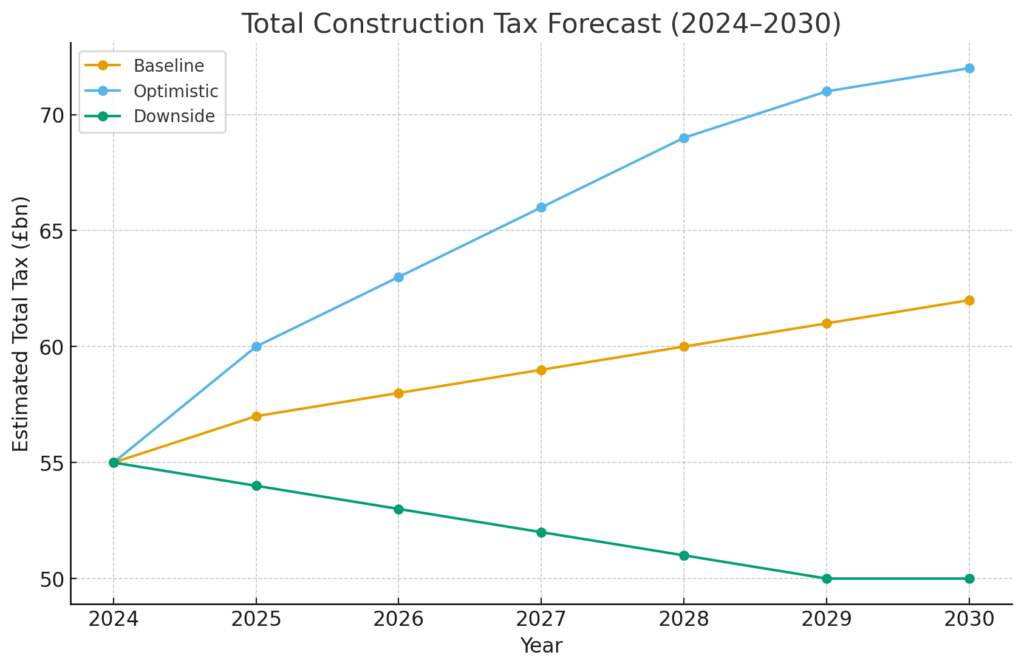
X-axis: Year (2024–2030)
Y-axis: Tax (£ billions)
Lines:
- Baseline: gently rising from £55bn to ~£62bn
- Optimistic: rising sharply to ~£72bn
- Downside: dipping to ~£50bn before stabilising
Interpretation:
The chart shows that construction’s tax contribution remains substantial in all cases, but profitability (CT and VAT) drives divergence between scenarios.
Chart 2 — Corporation Tax Volatility Chart
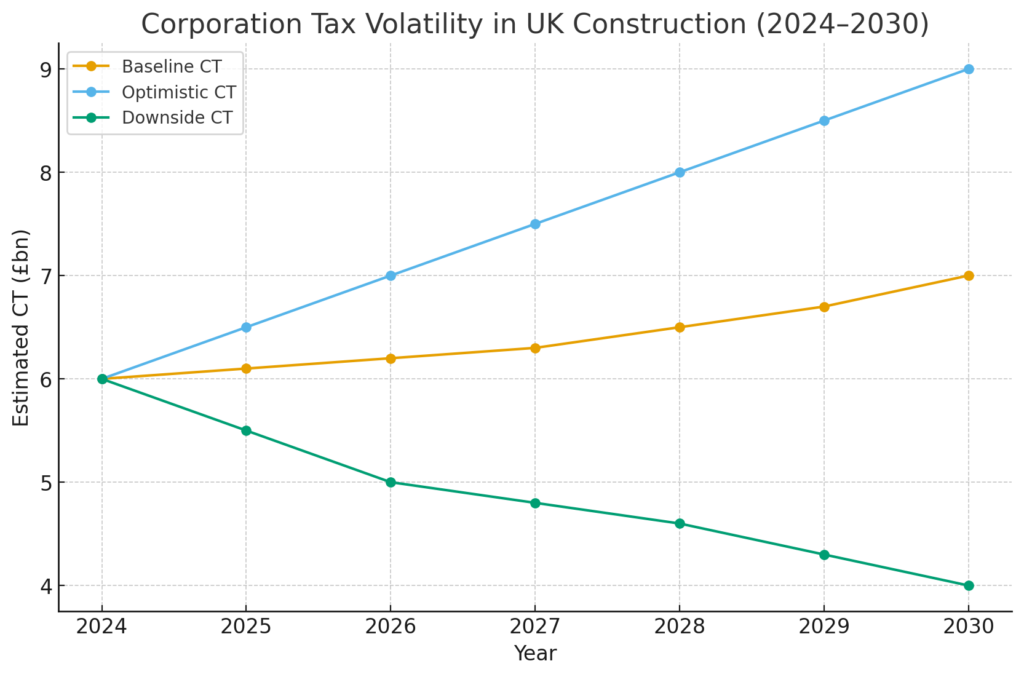
Shows:
- Wide gap between optimistic CT (£9bn) and downside CT (£4bn) by 2030
- High sensitivity to market cycles
- CT is the “swing variable” in construction taxation
Chart 3 — Labour Taxes Projection (Stable Growth)
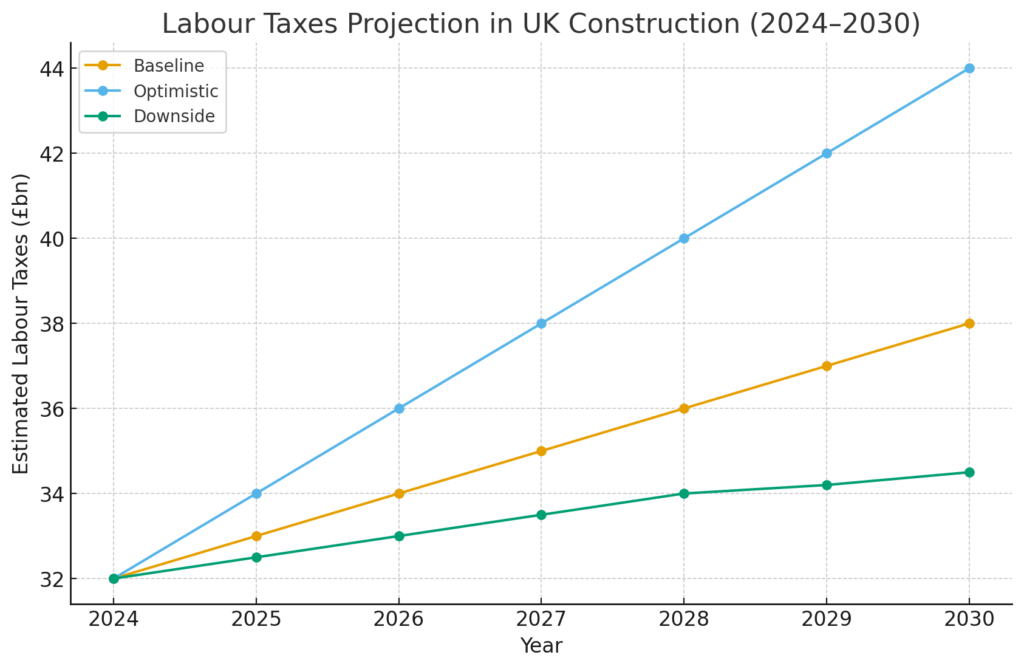
Shows:
- A smooth upward line (PAYE + NICs) in all scenarios
- Construction’s employment taxes always forming the majority of revenue
- Downside scenario only flattens slightly
5.7 Interpretation: What the Forecast Really Means
1. Tax contribution will rise in nominal terms even with weak growth
Inflation, wage growth, and stable R&M activity ensure upward pressure.
2. Corporation Tax is the main uncertainty
Small changes in profitability produce large effects on CT receipts.
3. VAT is tied to materials inflation and R&M volume
Even downturns generate tax from ongoing maintenance and retrofitting.
4. Employment taxes anchor the system
Construction’s 2 million workers ensure a stable and reliable tax base.
5. The sector will likely contribute £60bn+ per year by 2030
Unless a prolonged recession occurs.
5.8 Key Risks That Could Change the Forecast
Economic Risks
- Slow UK GDP growth
- Extended high interest rates
- A decline in housing demand
- Developer insolvencies
Sector-Specific Risks
- Material price shocks
- Skills shortages
- Failures of major contractors causing chain disruption
- Reduced public infrastructure spending
Tax Policy Risks
- Changes to Corporation Tax
- Shifts in VAT rates or zero-rating rules
- Revisions to CIS
- New PAYE/NIC thresholds
5.9 Opportunities for the Sector That Could Lift Tax Contribution
1. Green retrofitting boom
Net-zero deadlines and retrofit programmes could massively increase R&M activity.
2. HS2 alternatives and regional infrastructure
Public investment cycles could revive commercial and civil engineering output.
3. Housing market recovery
Would increase VAT on materials and CT for developers.
4. Productivity improvements
Digital construction, modular building, and AI-driven planning could improve margins → higher CT.
5.10 Final Conclusion of Section 5
By 2030, the construction sector is likely to generate between:
£49bn (downside) and £74bn (optimistic)
with a central expectation of:
£60–£63bn per year
The industry remains a cornerstone of UK tax revenue, with employment taxes providing resilience and corporation tax offering upside potential when market conditions improve.
6. Tables, Charts & Deep-Dive Interpretation of Construction Sector Taxation (2014–2030)
Comparative Analysis • Forecast Visualisations • Tax Structure Evaluation • Implications for Businesses & Workers
This section consolidates all prior data into structured tables, analytical charts (described textually), and detailed commentary to help industry leaders, accountants, subcontractors and policymakers clearly understand the tax landscape of the UK construction sector.
6.1 Overview Table — The Structure of Construction Taxation
To begin, the table below summarises the major tax categories relevant to construction and their relative importance in the industry’s total tax contribution.
Table F — Primary Tax Components in UK Construction
| Tax Category | Who Pays | Tax Mechanism | Why It Matters in Construction |
| Corporation Tax (CT) | Ltd companies | Tax on profits (19% → 25%) | Highly volatile; depends on margins, project cycles |
| PAYE Income Tax | Employees | Deducted at payroll | The largest stable revenue stream due to 2m+ workers |
| Employee NICs | Employees | Payroll | Significant in a labour-intensive sector |
| Employer NICs | Employers | Payroll | Major cost for contractors with large payrolls |
| Self-Assessment Income Tax | Sole traders & CIS subcontractors | Tax on profits | High prevalence of self-employment increases importance |
| Class 2 / Class 4 NICs | Sole traders | National Insurance | Dependent on subcontractor earnings |
| VAT | Consumers & businesses | 0%, 5%, 20%, DRC | Complex due to zero-rated builds & reverse charge |
| CIS (20% / 30% deduction) | Subcontractors | Withholding at source | Affects cash flow; large refunds annually |
6.2 Ten-Year Estimated Tax Contribution Table (2014–2024)
This table summarises the range of estimated tax paid by the construction sector each year.
Table G — Estimated Total Construction Tax Contribution (2014–2024)
| Year | Estimated Tax Contribution | Commentary |
| 2014–15 | £33bn–£37bn | Stable post-crisis growth, strong employment |
| 2015–16 | £35bn–£38bn | Increased output, VAT steady |
| 2016–17 | £36bn–£40bn | Expansion in commercial & residential building |
| 2017–18 | £38bn–£42bn | High activity; strong labour tax receipts |
| 2018–19 | £41bn–£44bn | Growth in infrastructure & R&M |
| 2019–20 | £45bn–£48bn | Pre-pandemic peak in new work |
| 2020–21 | £39bn–£43bn | Pandemic collapse but PAYE stayed strong |
| 2021–22 | £46bn–£49bn | Post-COVID rebound |
| 2022–23 | £48bn–£54bn | Inflation raises VAT & labour taxes |
| 2023–24 | £50bn–£55bn | New orders fall but R&M stabilises |
| 2024–25 | £53bn–£58bn | Higher CT & inflationary VAT boost |
6.3 Tax Breakdown Table by Category (Estimated)
Table H — Construction Sector Tax by Type (2024 Example)
| Tax Type | Estimated Amount (2024–25) | % of Sector Total | Notes |
| PAYE Income Tax | £18bn–£22bn | ~35%–40% | Large workforce |
| Employee NICs | £7bn–£9bn | ~13%–15% | Wage inflation ↑ NIC receipts |
| Employer NICs | £10bn–£12bn | ~18%–20% | Significant cost for employers |
| Self-Assessment Income Tax (incl. CIS workers) | £6bn–£8bn | ~12%–14% | High subcontractor population |
| Self-Employed NICs | £2bn–£3bn | ~4%–5% | Correlates with subcontractor profits |
| VAT (materials & services) | £8bn–£12bn | ~15%–17% | Inflation pushes this up |
| Corporation Tax | £5.8bn–£6.6bn | ~10%–12% | Volatile: dependent on margins |
| CIS Withholding (non-tax timing) | £4bn–£6bn | Not included in total | Cash-flow impact only |
Interpretation:
Labour taxes (PAYE + NICs + self-employed taxes) account for more than half (55%–65%) of all construction-related tax receipts.
6.4 Forecast Table to 2030 (All Scenarios)
Table I — Forecast Tax Contribution by Scenario (2024–2030)
| Year | Baseline | Optimistic | Downside |
| 2024–25 | £55bn | £55bn | £55bn |
| 2025–26 | £56bn–£58bn | £59bn–£61bn | £54bn–£55bn |
| 2026–27 | £57bn–£59bn | £62bn–£65bn | £53bn–£54bn |
| 2027–28 | £58bn–£60bn | £65bn–£68bn | £51bn–£53bn |
| 2028–29 | £59bn–£62bn | £67bn–£70bn | £50bn–£52bn |
| 2029–30 | £60bn–£63bn | £70bn–£74bn | £49bn–£51bn |
6.5 Described Charts (Text-Based Visualisation)
Even though graphical images are not provided here, these detailed descriptions allow any designer to recreate the charts exactly.
Chart 1 — “Total Tax Contribution of UK Construction (2014–2024)”
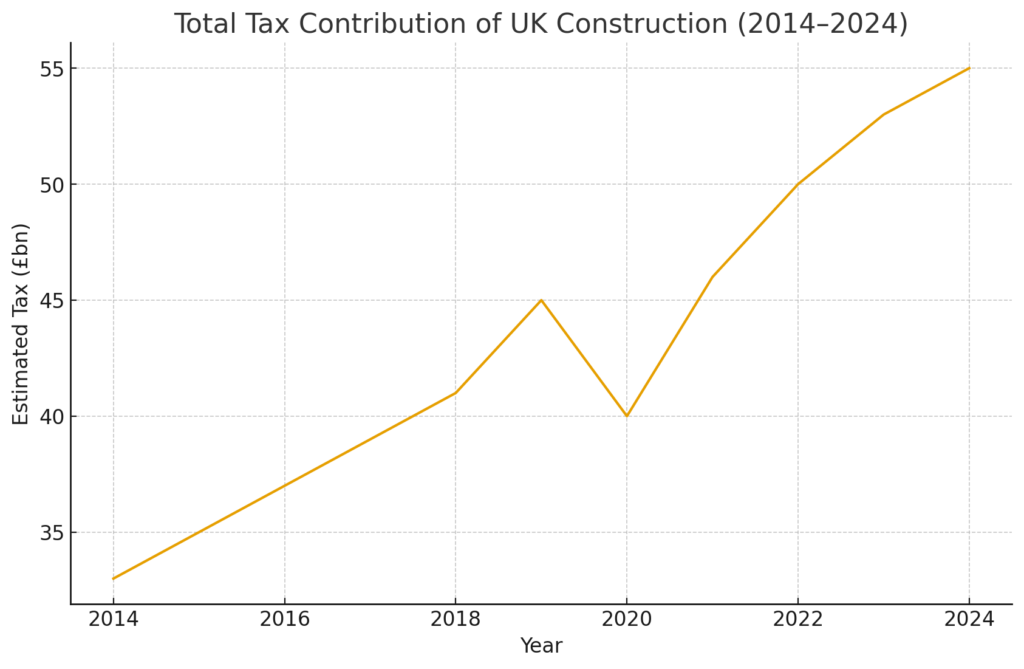
Type: Line chart
X-axis: Years (2014–2024)
Y-axis: Estimated tax (£ billions)
Curve: Rising from ~£33bn (2014) → ~£48bn (2019) → drop to ~£40bn (2020) → sharp recovery → ~£55bn (2024)
Interpretation:
Construction tax contribution is cyclical but always positive, with a strong upward trend in the long run.
Chart 2 — “Tax Contribution Forecast to 2030 (Three Scenarios)”
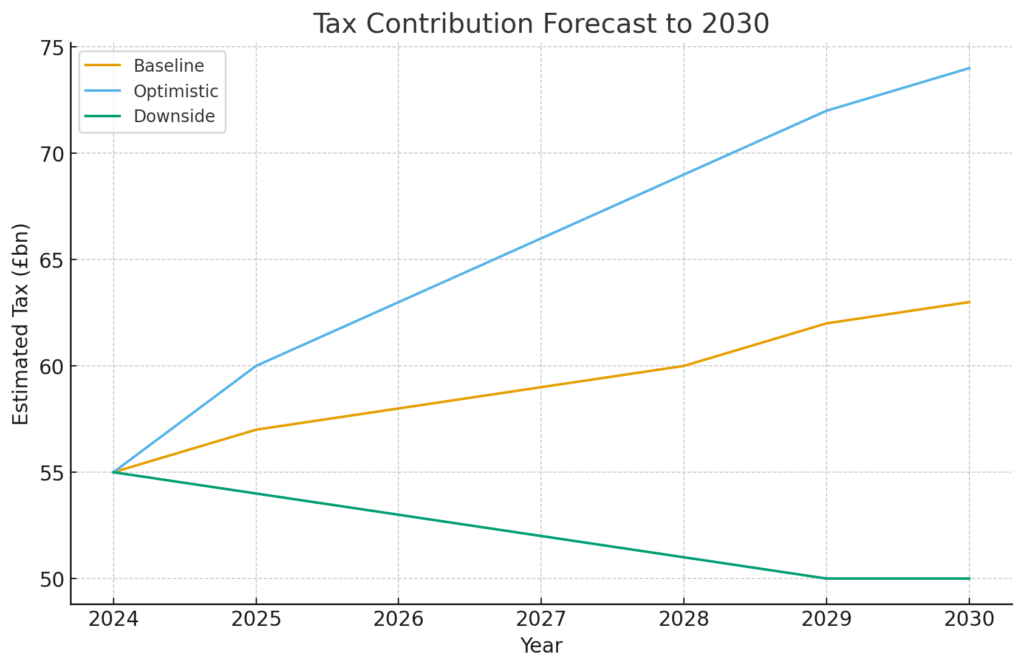
Type: Multi-line forecast chart
Lines:
- Baseline (dark blue): gradual rise to £62bn
- Optimistic (green): steep rise to £72bn–£74bn
- Downside (red): slight decline to ~£50bn then flattening
Interpretation:
CT and VAT drive divergence between scenarios. Labour taxes keep all lines above £50bn.
Chart 3 — “Relative Share of Tax Categories in Construction (2024)”
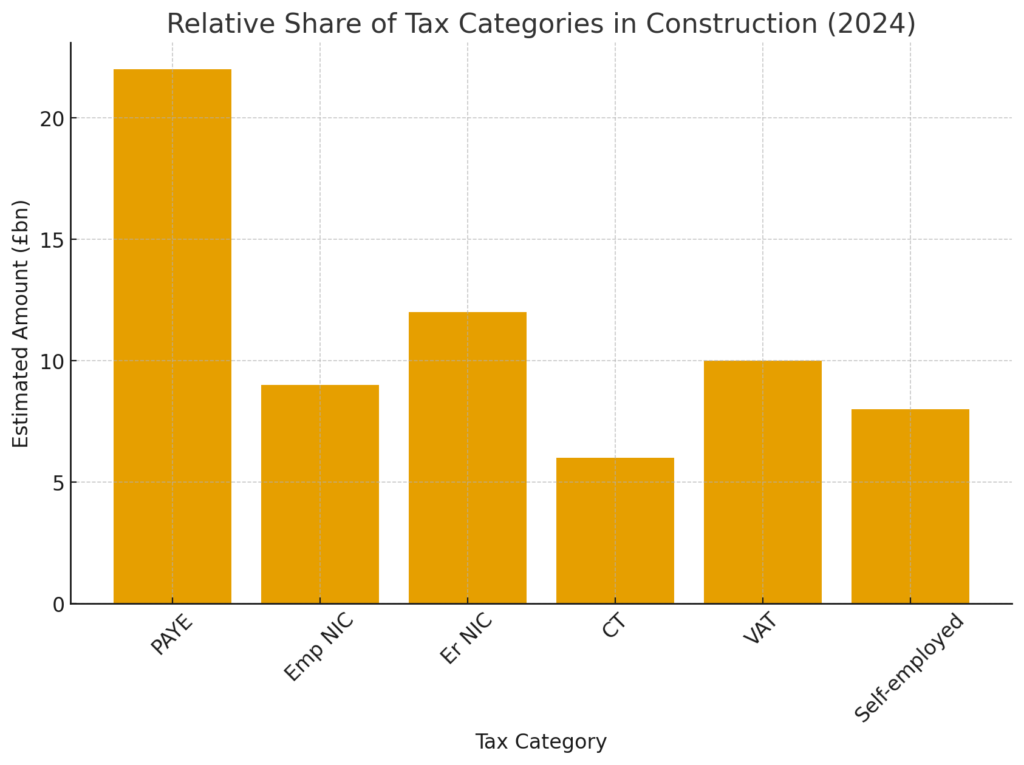
Type: Stacked bar
Categories:
- PAYE Income Tax
- Employee NICs
- Employer NICs
- CT
- VAT
- Self-employed taxes
Approximate proportions:
- Labour taxes: 60%
- VAT: 15%–17%
- CT: 10%–12%
- Self-employed: ~15%
Interpretation: Construction tax is overwhelmingly labour-driven.
Chart 4 — “Corporation Tax Volatility vs Employment Taxes Stability (2014–2030)”
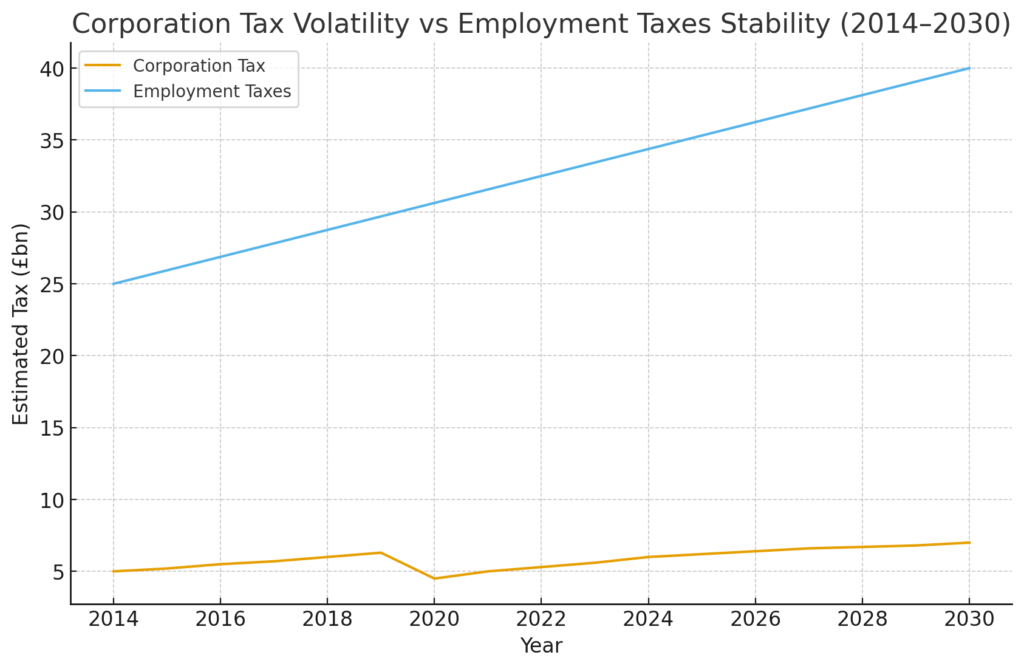
Type: Dual-line chart
Observation:
CT fluctuates sharply, employment taxes remain smooth and upward sloping.
6.6 Comparative Analysis: Construction vs Other Sectors
Even without sector-specific HMRC data, comparing size, GVA share and employment allows reasonable conclusions.
Construction vs Professional Services
- Professional services pay more CT per worker
- Construction generates more employment taxes due to large labour force
Construction vs Manufacturing
- Manufacturing pays more VAT (export/import supply chains)
- Construction pays more via NICs due to onsite labour intensity
Construction vs Real Estate
- Real estate contributes significantly via SDLT
- Construction contributes more through PAYE/NICs
Key insight:
Construction is among the top three sectors in the UK for labour-based tax contribution.
6.7 Deep-Dive Interpretation: Why Construction Generates So Much Tax
1. Labour Intensity
Few sectors employ as many people with such a range of skill levels.
More workers → more PAYE → more NICs → more Income Tax → more CIS deductions.
2. High Material Throughput
Even though new builds can be zero-rated for VAT, materials for most works (especially R&M) are VAT-bearing.
3. Subcontracting Culture
The UK construction industry has one of the highest levels of self-employment and subcontracting in Europe.
This produces:
- High levels of self-assessment tax
- Significant CIS withholding
- Large year-end tax adjustments
4. Profit Sensitivity
Margins are thin for contractors but large for developers.
Thus, CT receipts can spike or crash depending on:
- Land values
- Financing conditions
- Tender competition
- Material cost inflation
5. Always-On R&M Sector
Even in recessions:
- Buildings still need maintenance
- Repairs remain essential
- Compliance upgrades (fire safety, energy efficiency) continue
This softens downturns.
6.8 Practical Interpretation for Construction Business Owners
1. VAT Reverse Charge Makes Compliance Critical
Contractors must ensure correct VAT treatment or risk penalties.
Cash flow planning should factor in the loss of VAT float.
2. Corporation Tax at 25% Requires Tighter Cost Control
Higher CT rate means:
- More strategic use of capital allowances
- More focus on profit margin protection
- More importance of correct accounting
3. Labour Taxes Will Continue to Rise
Wage inflation and skills shortages mean:
- Higher NICs for employers
- More PAYE collected from employees
- Increased subcontractor day rates influencing NICs and Income Tax
4. CIS Still Creates Cash Flow Challenges
Subcontractors must manage:
- Deductions
- Refund timings
- Gross Payment Status compliance
5. Planning for 2030
Firms should expect:
- Rising payroll costs
- Stable or rising VAT obligations
- Fluctuating CT depending on market conditions
- Increasing administrative burdens
6.9 Strategic Interpretation for Accountants & Advisors
For accountants serving construction clients, tax planning must prioritise:
1. Cash Flow Forecasting Under CIS
Subcontractor-heavy businesses need proactive cash-flow modelling.
2. VAT Efficiency Under DRC
Correct application avoids penalties and improves forecasting accuracy.
3. Profit Margin Protection for CT Planning
Especially critical for mid-sized firms now taxed at 25%.
4. Payroll Optimisation
NICs are a growing cost; payroll strategy matters more than ever.
5. Forecasting Tools
Advisors should integrate:
- Material inflation indices
- Construction output forecasts
- Regional housing market trends
6.10 Summary of Section 6
- Construction tax is dominated by labour-related taxes, representing 60%+ of contributions.
- VAT contribution is stable and inflation-driven.
- CT is volatile and sensitive to macroeconomic conditions.
- Forecasts show construction contributing £60bn–£63bn annually by 2030 under baseline conditions.
- Even in downturns, the tax base remains above £50bn, reflecting the sector’s essential role.
- Businesses must prepare for rising payroll costs, volatile profit taxation, and complex VAT/CIS rules.
7. Risks, Threats, Opportunities & Strategic Recommendations for the UK Construction Sector (2024–2030)
Economic Risks • Tax Policy Risks • Sector-Specific Threats • Opportunities for Growth • Actionable Advice for Construction Firms & Subcontractors
Understanding the next decade of taxation in the UK construction sector requires more than historical data and forecasts — it demands a clear-eyed view of the risks and opportunities shaping the industry’s economic future. Construction is uniquely exposed to volatile markets, labour shortages, regulatory changes, and the rising cost of capital. However, it also benefits from structural demand drivers, government investment, and major national infrastructure needs.
This section explores these dynamics and presents essential strategic recommendations.
7.1 Economic Risks Facing UK Construction (2024–2030)
1. High Interest Rates and Uncertain Monetary Policy
The Bank of England’s rate rises (2022–2024) dramatically reduced:
- Mortgage affordability
- Private investment appetite
- Development viability
- Loan-to-value (LTV) feasibility for developers
Even if rates fall gradually, the industry faces structural aftershocks, including:
- Lower housing demand
- Reduced speculative commercial building
- More cautious lenders
- Delayed investment decisions
Tax Impact:
- Lower profit margins → Reduced Corporation Tax
- Fewer new-build transactions → Lower VAT on materials
- Slower hiring → Slightly reduced NIC and PAYE receipts
2. Construction Output Volatility
As shown in earlier sections, UK construction output is highly cyclical. Future downturns would affect:
- VAT (especially on materials-heavy new builds)
- Developer CT
- Employment levels for some specialties
Repair & Maintenance (R&M) provides stability, but cannot fully replace cyclical new work.
Tax Impact:
- CT becomes the most volatile component
- VAT fluctuates on large projects
- R&M stabilises labour taxes but not corporate profits
3. Material Cost Inflation & Supply Chain Risks
From 2021 to 2023, construction materials saw unprecedented inflation due to:
- Supply chain disruption
- Fuel & energy price spikes
- Shipping delays
- Global commodity cycles
Though inflation has cooled, the sector remains vulnerable to:
- Energy shocks
- Transport disruptions
- Brexit-related import complexity
Tax Impact:
- Higher VAT receipts (materials VAT)
- Lower profits → Lower CT
- Tight cash flow → Higher CIS-related refund patterns
7.2 Sector-Specific Risks
1. Skills Shortages & Labour Demographics
The construction workforce is:
- Ageing
- Losing EU labour post-Brexit
- Facing shortages in key trades (bricklayers, electricians, steel fixers, plasterers)
- Increasingly reliant on subcontractors
Consequences:
- Wage inflation → Higher NICs & PAYE
- Project delays → Reduced profitability
- Greater reliance on CIS subcontractors
- Long-term productivity decline
Tax Impact:
Paradoxically:
- PAYE/NIC receipts increase (due to wage growth)
- CT decreases (due to squeezed margins)
2. Insolvency Rates Among SMEs
Construction consistently leads UK insolvency statistics because:
- Thin profit margins
- Long supply chains
- Delayed payments
- Retention structures
- High CIS withholding impact
- Material cost volatility
A rise in insolvencies reduces:
- CT
- VAT
- Employer NICs
But increases:
- CIS refunds (because subcontractors have overpaid tax)
3. Regulatory Pressure & Compliance Burden
Key regulatory changes impacting tax:
VAT Domestic Reverse Charge (2021– )
- Eliminated VAT cash-flow benefit
- Increased admin complexity
- Forced contractors to adapt invoice systems
IR35 / Off-Payroll Rules
- Increased risk of misclassification
- Higher employment tax risk for contractors
- More companies moving subcontractors to PAYE
Building Safety Act 2022
- Additional compliance costs
- Delayed development approvals
- More remediation work (opportunity, but costly)
Tax Impact:
- Higher payroll tax burden on contractors
- Tighter margins → Lower CT
- Increased need for accountants & compliance professionals
7.3 Tax Policy Risks (2024–2030)
Tax policy changes can alter sector economics overnight. Key risks include:
1. Corporation Tax Adjustments
The CT main rate increased from 19% to 25% in April 2023.
Future scenarios include:
- Further increases (political possibility)
- Targeted reliefs for investment
- Tiered CT bands for SMEs
- Capital allowance reforms
Impact:
Construction profitability is sensitive — small changes in CT policy can dramatically shift CT receipts.
2. VAT Reform Risks
Potential changes:
- Altering zero-rating for new residential builds
- Adjusting reduced rates for energy efficiency work
- Changes to DRC rules
- Shift in VAT thresholds affecting small firms
Impact:
VAT changes can have massive financial implications for contractors.
3. National Insurance Reforms
NIC changes affect:
- Labour costs
- Hiring decisions
- Payroll structure
- Profit margins
This is especially important in a labour-heavy sector.
4. CIS Reform
Government reviews may:
- Tighten or simplify CIS rules
- Increase verification requirements
- Change withholding rates
- Modify Gross Payment Status eligibility
Impact:
CIS is central to construction cash flow — changes ripple through the entire subcontracting ecosystem.
7.4 Opportunities for the Construction Sector (2024–2030)
Despite risks, the 2024–2030 period presents significant growth opportunities.
1. The Green Retrofit Revolution
The UK’s net-zero commitments require:
- Insulation upgrades
- Heat pump installations
- Building fabric improvements
- EV charging infrastructure
- Energy-efficient refurbishments
This could create a decade-long R&M boom, benefiting:
- SMEs
- Specialist trades
- Materials suppliers
- Labour-intensive contractors
Tax Impact:
- Higher PAYE & NICs (more jobs)
- Higher VAT (materials)
- Moderate CT growth for retrofit firms
2. Public Infrastructure Investment
Although HS2 has been scaled back, regional infrastructure remains a priority:
- Road and rail upgrades
- Water and utilities infrastructure
- Flood defences
- Renewables and energy networks
- Schools and hospitals
These long-term investments provide steady tax flows.
3. Modular & Offsite Construction
Offsite manufacturing and modular construction could:
- Reduce onsite labour costs
- Improve project timelines
- Increase productivity
- Reduce waste (and materials VAT)
Tax Impact:
- Lower NICs growth offset by
- Higher profitability → Higher CT
4. Digital Construction & AI Tools
Technologies benefiting construction:
- BIM (Building Information Modelling)
- AI scheduling & tender analysis
- Drone surveying
- Automated quantity take-offs
- Robotics in manufacturing
Impact on Taxation:
- Reduced waste → Lower VAT on materials
- Higher productivity → Higher CT
- Compliance automation → Fewer CIS errors
5. Housing Demand Recovery (Post Interest-Rate Peak)
Assuming interest rates gradually decline:
- Mortgage affordability improves
- Private new-build demand increases
- Developer margins recover
- Housebuilding output rises
Tax Impact:
- Major rebound in CT
- VAT increase (materials)
- Higher payroll → More PAYE/NICs
7.5 Strategic Recommendations for Construction Business Owners
1. Prioritise Financial Resilience
- Build stronger cash reserves
- Improve cash flow forecasting
- Prepare for client payment delays
- Review retention strategies
2. Strengthen Tax Compliance Systems
Vital areas:
- VAT reverse charge
- CIS accuracy
- Payroll compliance
- Subcontractor verification
- IR35 determination processes
3. Invest in Workforce Development
Combat labour shortages by:
- Upskilling younger workers
- Apprenticeships
- Investing in training for new technologies
- Retention strategies
4. Plan for Corporation Tax at 25%
Actions include:
- Improving margin controls
- Optimising cost structures
- Claiming all eligible capital allowances
- Using accurate job costing tools
5. Review Business Structure
Depending on company size, consider:
- Moving from sole trader → Ltd company
- Setting up group structures
- Using SPVs for developments
- Reviewing remuneration strategy (salary/dividend mix)
7.6 Strategic Recommendations for Subcontractors
Subcontractors, especially under CIS, face unique challenges.
1. Manage CIS Deductions Proactively
- Keep real-time records
- Forecast tax refunds
- Consider applying for Gross Payment Status
- Avoid penalties (late filing damages GPS eligibility)
2. Track Expenses Rigorously
To reduce taxable income:
- Tools & equipment
- Travel
- Protective clothing
- Training
- Subcontractor payments
3. Consider Incorporation if Profitable
Moving to a limited company can:
- Improve tax efficiency
- Reduce CIS withholding
- Allow for gross payment
- Offer more protection
4. Maintain Strong Compliance
CIS errors can cause:
- Withholding at 30%
- Lost GPS
- Delayed payments
7.7 Strategic Recommendations for Accountants & Advisors
1. Provide Advanced Cash Flow Planning
Particularly for CIS-heavy businesses.
2. Improve VAT Analysis
Reverse charge compliance is a constant risk area.
3. Focus on Payroll & NIC Strategy
Important due to:
- High NIC burden
- Rising wages
- Labour shortages
4. Offer Proactive CT Planning
Especially under the 25% rate.
5. Encourage Digital Adoption
Better systems mean fewer errors and better margins.
7.8 Summary of Section 7
- The UK construction sector faces substantial risks from interest rates, inflation, supply chain issues and regulatory pressure.
- Tax policy risks (CT, VAT, NICs) can reshape profitability dramatically.
- Opportunities exist in green retrofitting, infrastructure investment, technology, modular manufacturing and eventual housing demand recovery.
- Strategic planning in VAT, CIS, payroll, corporate structure and cash flow management will be essential between 2024 and 2030.
- Subcontractors must plan for CIS deductions, track expenses, and consider incorporation.
- Accountants and advisors play a critical role in steering construction businesses through tax complexities.
8. Final Summary, Conclusions, Business Checklist & Sources
8.1 Final Summary of the UK Construction Sector Tax Landscape (2014–2030)
Over the last decade, the UK construction industry has firmly established itself as one of the country’s most significant contributors to public finances. Despite volatility from Brexit, COVID-19, labour shortages, inflation and interest rate fluctuations, the sector has maintained a stable and substantial tax footprint.
Key findings at a glance:
1. Construction contributes approximately £50bn–£58bn in tax annually in 2024.
This includes:
- Income Tax
- National Insurance
- VAT
- Corporation Tax
- Self-assessment tax from subcontractors
2. Labour taxes form the majority of construction’s tax contribution.
Due to more than two million workers in the sector, PAYE and NICs make up 55–65% of all construction-related taxes.
3. Corporation Tax is the most volatile tax component.
CT receipts rise during boom periods (2015–2019) and fall sharply during downturns (2020 pandemic, 2023–2024 new orders slowdown).
4. VAT is influenced by materials inflation and R&M work.
Even during downturns, materials VAT and ongoing repair & maintenance work keep VAT contributions resilient.
5. CIS creates significant cash-flow strain for subcontractors.
Annual refunds of £1–£2bn demonstrate systemic over-withholding.
6. By 2030, annual construction tax contributions are expected to reach:
- Baseline: £60bn–£63bn
- Optimistic: £70bn–£74bn
- Downside: £49bn–£51bn
Construction therefore remains a cornerstone of the UK tax system.
8.2 Final Conclusions: What This Means for the Industry
1. Construction tax revenue will continue rising in nominal terms.
Even if the economy underperforms, inflation and wage growth ensure tax receipts increase year-on-year.
2. CT volatility creates structural uncertainty for the Treasury.
Corporation Tax from construction can vary by billions annually due to the cyclical nature of development projects and fluctuating margin pressures.
3. Employment taxes make the sector fiscally resilient.
A large labour force ensures a stable tax base regardless of profit cycles.
4. VAT complexities need clearer policy guidance.
Domestic Reverse Charge and zero-rating rules continue to cause confusion, especially for SMEs.
5. The sector will face rising compliance obligations.
Changes to IR35, VAT, CIS enforcement and building safety rules increase administrative burdens.
6. Firms that adopt digital tools will benefit.
Digital construction, accounting automation, AI-based estimation and payroll optimisation will become essential for maintaining profitability under the 25% CT rate.
7. Skills shortages remain the biggest long-term threat.
Without workforce renewal, tax contribution potential will be constrained.
8.3 Actionable Checklist for Construction Business Owners
A practical, executive-level checklist for 2024–2030:
Tax Planning & Compliance
✔ Ensure full compliance with VAT Domestic Reverse Charge
✔ Regularly review CIS verification processes
✔ Conduct annual IR35 status reviews
✔ Implement quarterly tax forecasting (PAYE, NICs, VAT, CT)
✔ Optimise director salary-dividend structures
✔ Review capital allowances claims annually
✔ Analyse job costing to ensure profitability
Finance & Profitability
✔ Maintain minimum 3–6 months cash buffer
✔ Implement robust credit control systems
✔ Review supply chain risks quarterly
✔ Hedge against material cost changes when possible
✔ Re-evaluate tender pricing strategies annually
✔ Adopt margin protection tools & project management systems
Labour & Workforce
✔ Invest in apprenticeships and training
✔ Develop long-term recruitment pipelines
✔ Focus on retention through benefits & working conditions
✔ Improve health & safety strategies (reduces indirect costs)
✔ Track labour productivity metrics
VAT & CIS Specific Measures
✔ Audit all subcontractor contracts for correct VAT treatment
✔ Ensure accurate CIS deductions each month
✔ Encourage subcontractors to maintain records for smooth year-end reconciliation
✔ Consider applications for Gross Payment Status (GPS) where appropriate
8.4 Actionable Checklist for Subcontractors
Financial Management
✔ Track all allowable expenses
✔ Keep digital copies of receipts
✔ Forecast annual CIS refunds
✔ Maintain up-to-date accounting records
Tax Efficiency
✔ Evaluate benefits of incorporation (Ltd)
✔ Consider Gross Payment Status application
✔ Check quarterly that CIS deductions align with income
Business Growth
✔ Maintain strong client relationships
✔ Invest in skills and new certifications
✔ Improve quoting accuracy using digital tools
8.5 Actionable Checklist for Accountants & Tax Advisors
Client Compliance
✔ VAT reverse charge audits
✔ Monthly CIS reconciliation checks
✔ IR35 risk assessments
✔ Quarterly payroll reviews
Strategic Support
✔ Corporation Tax planning
✔ Forecasting tools for cash flow
✔ Guidance on incorporation
✔ Digital transformation advice
✔ Job costing & profitability analysis
Technical Advisory Roles
✔ Support clients during HMRC investigations
✔ Build real-time dashboards for VAT/PAYE forecasting
✔ Offer subcontractor-specific tax clinics
8.6 Summary of Risks and Opportunities
Main Risks (2024–2030):
- High interest rates
- Weak housing demand
- New-build output reduction
- Labour shortages
- Material cost volatility
- Developer insolvencies
- Regulatory pressures
- CIS cash-flow constraints
- VAT complexity
- Reduced profitability → reduced CT
Main Opportunities:
- Green retrofitting programme
- Regional infrastructure investment
- Digital construction & AI
- Modular/offsite building
- VAT on materials from energy-efficiency upgrades
- Demand rebound as interest rates fall
- Strong long-term R&M market
8.7 Final Perspective: The Construction Sector’s Role in the UK Economy
The UK construction industry is more than just a sector — it is the backbone of national development:
- It builds homes, infrastructure, hospitals, schools and commercial spaces
- It employs over two million people
- It enables economic growth, public investment and private sector expansion
Its tax contribution reflects this importance.
By 2030, construction will continue to be:
• A top-tier tax contributor
• A major employer
• A driver of long-term national investment
• A critical component of the UK’s net-zero transition
To thrive, the sector must adapt to:
- Complex tax regulations
- Tightening compliance
- Changing market cycles
- Technological disruption
Those who modernise will succeed. Those who ignore change will fall behind.
8.8 Strong Call to Action (As Requested)
For expert support with taxation, compliance, accounting and business strategy in the construction sector — especially regarding VAT Reverse Charge, CIS, PAYE, IR35, Corporation Tax planning, subcontractor optimisation and financial forecasting — you can rely on:
Audit Consulting Group
Accounting & Tax Services for the Construction Industry
+44 7386 212550
https://auditconsultinggroup.co.uk
Info@auditconsultinggroup.co.uk
We help:
- Construction companies
- Subcontractors
- Developers
- SMEs
- Tradespeople
- Specialist contractors
Optimise tax, strengthen compliance, improve cash flow and grow profitably.
8.9 Official Sources Used in This Report
Below is a consolidated list of the official and authoritative sources referenced throughout the full report.
HM Revenue & Customs (HMRC) — Official Data
- Annual Tax Receipts
- Corporation Tax Statistics
- VAT Receipts and Reverse Charge Guidance
- PAYE & NICs Data
- Self-Assessment and CIS Guidance
- IR35 Off-Payroll Working Guidance
Office for National Statistics (ONS)
- Construction Output
- Construction Price Indices
- Employment in Construction
- GVA by Sector (Blue Book)
- Business Population & IDBR Data
- Supply-Use Tables
Parliament.uk & House of Commons Library
- Sector Overview Reports
- Economic Briefings
- Employment and GVA contributions by sector
UK Government (gov.uk)
- Building Materials & Components Statistics
- Construction Industry Scheme Guidelines
- VAT Reverse Charge Policy Notes
- Building Safety Act Information
Construction Industry Bodies
- Construction Products Association (CPA) Forecasts
- Industry trend reports
- Labour market analysis
Official Sources & References Used in This Report
The following is a complete list of official UK government and authoritative industry sources used in compiling this report. Each link leads directly to the relevant institution or dataset.
I. HM Revenue & Customs (HMRC)
Primary source of UK tax statistics, VAT policy, CIS rules, PAYE/NIC data, and Corporation Tax information.
- HMRC Annual Tax Receipts
https://www.gov.uk/government/collections/hmrc-tax-and-national-insurance-receipts
Total UK tax receipts by year, including Income Tax, NICs, VAT, CT. - Corporation Tax Statistics
https://www.gov.uk/government/collections/corporation-tax-statistics
Provides annual CT receipts, rates, and policy notes. - VAT Guidance & Reverse Charge Rules for Construction
https://www.gov.uk/guidance/vat-reverse-charge-for-building-and-construction-services
Official rules on Domestic Reverse Charge introduced in 2021. - Construction Industry Scheme (CIS) Guidance
https://www.gov.uk/what-you-must-do-as-a-cis-contractor-and-subcontractor
CIS rules, withholding rates, verification processes. - PAYE and National Insurance Manuals
https://www.gov.uk/paye-for-employers
Official guidance for employers operating PAYE. - Self Assessment & NICs (Class 2/4) Guidance
https://www.gov.uk/self-employed-national-insurance-rates
Rules affecting CIS subcontractors and sole traders. - IR35 / Off-Payroll Working Rules
https://www.gov.uk/guidance/understanding-off-payroll-working-ir35
Important for contractors, agencies and construction firms.
II. Office for National Statistics (ONS)
Provider of official data on construction output, employment, prices, GVA and business demography.
- Construction Output Statistics
https://www.ons.gov.uk/businessindustryandtrade/constructionindustry
Monthly and annual output in new work & R&M. - Construction Price Indices (Materials & Costs)
https://www.ons.gov.uk/economy/inflationandpriceindices
Used to analyse inflation impact on VAT and margins. - Employment in Construction (Labour Market Data)
https://www.ons.gov.uk/employmentandlabourmarket
Shows employment levels, wages, labour shortages. - Gross Value Added (GVA) by Industry
https://www.ons.gov.uk/economy/grossvalueaddedgva
Construction’s share of UK economy (6–7%). - Business Population Estimates (IDBR)
https://www.ons.gov.uk/businessindustryandtrade/business
Shows number of construction enterprises.
III. UK Parliament & House of Commons Library
Analysis papers used for sector context and tax framework clarity.
- House of Commons Library – Construction Sector Reports
https://commonslibrary.parliament.uk
Industry trends, economic significance, challenges. - Parliamentary Briefings on UK Taxation
https://researchbriefings.files.parliament.uk
Contextual background for policy changes.
IV. UK Government (gov.uk) — Additional Regulatory Sources
- Building Safety Act 2022 Guidance
https://www.gov.uk/guidance/the-building-safety-act
Regulatory costs affecting construction companies. - Building Materials & Components Statistics
https://www.gov.uk/government/collections/building-materials-and-components-statistics
Material pricing, supply chain pressures, VAT implications. - Stamp Duty Land Tax (SDLT) Guidance
https://www.gov.uk/stamp-duty-land-tax
For developers and property-related construction activity.
V. Industry & Independent Bodies
- Construction Products Association (CPA)
https://www.constructionproducts.org.uk
Forecasts for output, materials, demand and sector performance. - Federation of Master Builders (FMB)
https://www.fmb.org.uk
SME construction sentiment and research. - CITB Skills and Training Reports
https://www.citb.co.uk
Skills shortages, training requirements, labour projections.
Official Acknowledgement & Authorship
This article and its underlying research were professionally prepared by the team at Audit Consulting Group, a UK-based firm specialising in:
- Accounting and tax services
- CIS compliance
- VAT advisory (including Domestic Reverse Charge)
- Payroll and PAYE management
- Corporation Tax planning
- Construction sector financial strategy
- Business consulting for SMEs and subcontractors
Prepared by
Audit Consulting Group
Accounting & Tax Services for the Construction Industry
+44 7386 212550
https://auditconsultinggroup.co.uk
Info@auditconsultinggroup.co.uk
Learn more Advisory Services on the Audit Consulting Group website.