
UK HOTEL INDUSTRY: STRUCTURE, PERFORMANCE (2020–2025) & CORE METRICS
1. Introduction: Strategic Importance of the UK Hotel Sector
The UK hospitality sector remains a critical pillar of the national economy, comprising over 176,000 businesses as of 2025, the vast majority being SMEs.
Hotels form a high-value subset of this ecosystem due to:
- strong links to tourism, business travel, and events
- ability to generate foreign currency inflows
- high employment intensity
- asset-backed investment attractiveness
However, between 2020 and 2025, the industry experienced:
- the COVID-19 shock (2020–2021)
- rapid recovery (2022–2023)
- stabilisation with margin pressure (2024–2025)
2. Key Performance Indicators (KPIs) in Hotel Economics
To evaluate profitability and performance, the UK hotel sector relies on several core metrics:
| KPI | Definition | Importance |
|---|---|---|
| Occupancy Rate | % of rooms sold | Demand indicator |
| ADR (Average Daily Rate) | Average price per sold room | Pricing power |
| RevPAR | Revenue per available room | Combined performance |
| GOPPAR | Gross operating profit per available room | Profitability |
| Profit Margin | % of revenue retained as profit | Efficiency |
3. UK Hotel Market Size & Structure (2020–2025)
3.1 Industry Composition
| Indicator | Value |
|---|---|
| Total hospitality businesses (UK, 2025) | 176,685 |
| SME share | 99.6% |
| Small businesses | 97.7% |
Interpretation:
The hotel market is highly fragmented, with:
- independent hotels dominating supply
- chains dominating revenue and profitability
4. Performance Evolution: 2020–2025
4.1 Occupancy Trends
| Year | Approx. Occupancy UK | Notes |
|---|---|---|
| 2020 | ~30–40% | Pandemic collapse |
| 2021 | ~45–55% | Partial reopening |
| 2022 | ~65–70% | Strong recovery |
| 2023 | ~70–75% | Stabilisation |
| 2025 | ~56% avg (annual) | Mixed performance |
Additional data:
- London occupancy reached ~82.5% in 2025
- England early 2026 monthly occupancy ~65–74%
Insight:
- Recovery strongest in urban and luxury segments
- regional markets lag but stabilising
4.2 Average Daily Rate (ADR)
| Year | ADR UK (£) | Trend |
|---|---|---|
| 2020 | ↓ sharply | Discounting |
| 2021 | low | Recovery phase |
| 2022 | rising | Demand surge |
| 2023 | strong growth | Inflation pass-through |
| 2025 | ~£135 avg | Plateau |
Recent dynamics:
- ADR increased slightly from £189 → £191.55 (2024–2025)
- London ADR ~£278 (premium segment)
Insight:
- ADR growth is slowing due to:
- consumer price sensitivity
- competition
- economic uncertainty
4.3 Revenue per Available Room (RevPAR)
| Year | RevPAR Trend |
|---|---|
| 2020 | Collapse |
| 2021 | Partial recovery |
| 2022 | Rapid rebound |
| 2023 | Peak recovery |
| 2025 | Volatile but stable |
Key figures:
- UK average RevPAR ~£75 (2025)
- London RevPAR ~£200+ in premium markets
2025 dynamics:
- RevPAR growth driven by occupancy gains rather than pricing
4.4 Profitability (GOPPAR & Margins)
| Metric | Value (2025) |
|---|---|
| London GOPPAR | £111.60 |
| Regional GOPPAR | £37 |
| London margin | ~41.1% |
| Regional margin | ~30.3% |
However:
- Profit margins declined in some segments to ~34–35%
- December 2025 UK margin ~35.4%
Key observation:
Revenue recovery ≠ profit recovery
5. Key Drivers of Profitability (2020–2025)
5.1 Positive Drivers
| Factor | Impact |
|---|---|
| Post-pandemic travel boom | Strong demand rebound |
| Leisure tourism | Major growth driver |
| Events & concerts | Seasonal spikes |
| Luxury segment strength | High-margin revenue |
Example:
- Leisure revenue grew ~6% in 2025
5.2 Negative Drivers
| Factor | Impact |
|---|---|
| Labour costs ↑ | Major margin pressure |
| Energy costs ↑ | Operational burden |
| Business rates ↑ | Profit erosion |
| Inflation | Demand sensitivity |
Key data:
- Labour and materials costs are the main constraint on turnover
- Business rates expected to significantly impact profitability
6. Regional Performance Differences
6.1 London vs Regional UK
| Metric | London | Regions |
|---|---|---|
| Occupancy | 80–84% | 55–70% |
| ADR | £200–£280 | £100–£150 |
| RevPAR | £180–£200+ | £70–£100 |
| Profit margin | ~41% | ~30% |
Sources:
Insight:
- London remains premium, global demand-driven market
- regions depend on:
- domestic tourism
- seasonal flows
7. Investment & Capital Trends
7.1 Investment Activity
- UK hotel deals reached ~£3.08 billion in H1 2024
- Driven by:
- private equity
- international capital
- yield attractiveness vs offices
7.2 Structural Shift
| Segment | Trend |
|---|---|
| Budget chains | Growth |
| Independent hotels | Decline |
| Luxury | Strong resilience |
Example:
- Large operators expanding room supply and converting assets
8. Summary of 2020–2025 Phase
Key Conclusions
- Full recovery achieved in demand (occupancy)
- ADR growth slowing due to price sensitivity
- Profitability under pressure from costs
- London outperforming rest of UK
- Investment remains strong despite risks
9. Key Data Summary Table (2025 Snapshot)
| KPI | UK Average | London |
|---|---|---|
| Occupancy | ~56% | ~82.5% |
| ADR | £135 | £200–£280 |
| RevPAR | £75 | £200+ |
| Profit margin | ~35% | ~41% |
FINANCIAL MODELLING, PROFITABILITY DRIVERS & FORECAST (2026–2030)
10. Historical Financial Model (2019–2025)
To understand future profitability, it is critical to reconstruct a normalized performance baseline using pre-pandemic and post-recovery data.
10.1 Core KPI Time Series (UK Market Average)
| Year | Occupancy (%) | ADR (£) | RevPAR (£) | Est. GOPPAR (£) | Profit Margin (%) |
|---|---|---|---|---|---|
| 2019 | 76% | 120 | 91 | 45 | 42% |
| 2020 | 35% | 85 | 30 | -5 to 5 | negative |
| 2021 | 52% | 95 | 49 | 15 | 20–25% |
| 2022 | 68% | 115 | 78 | 35 | 32% |
| 2023 | 72% | 130 | 94 | 42 | 36% |
| 2024 | 70% | 138 | 97 | 40 | 34% |
| 2025 | 56% (avg distortion*) | 135 | 75 | 37 | ~35% |
*2025 shows volatility due to uneven regional and seasonal demand.
Key takeaway:
The industry has recovered in revenue terms but not fully in margins, primarily due to structural cost inflation.
11. Cost Structure Analysis (UK Hotels)
Understanding profitability requires analysing the typical cost base of UK hotels.
11.1 Cost Breakdown (% of Revenue)
| Cost Category | 2019 | 2025 | Change |
|---|---|---|---|
| Labour | 28–32% | 32–38% | ↑ significant |
| Energy | 4–6% | 7–10% | ↑ sharp |
| Food & Beverage | 10–12% | 11–13% | ↑ moderate |
| Maintenance | 6–8% | 7–9% | ↑ |
| Business rates / taxes | 5–7% | 7–9% | ↑ |
| Distribution (OTAs) | 8–10% | 9–12% | ↑ |
Conclusion:
Profit compression is primarily driven by:
- wage inflation (labour shortages)
- energy price shocks
- tax/regulatory pressures
12. Profitability Bridge (2019 vs 2025)
12.1 Margin Decomposition
| Driver | Impact on Margin |
|---|---|
| ADR growth | +8–10% |
| Occupancy decline | -5–7% |
| Labour cost inflation | -6–8% |
| Energy inflation | -3–4% |
| Net impact | -6 to -8% margin vs 2019 |
Even with higher room rates, cost inflation has offset gains.
13. Demand Drivers for 2026–2030
13.1 Positive Drivers
| Driver | Expected Impact |
|---|---|
| International tourism recovery | Strong |
| Weak GBP (currency advantage) | Positive |
| Event tourism (sports, concerts) | Moderate-high |
| Premium/luxury growth | Strong |
| “Bleisure” travel trend | Structural growth |
13.2 Risk Factors
| Risk | Impact |
|---|---|
| Economic slowdown (UK/EU) | Demand pressure |
| Interest rates | Investment slowdown |
| Labour shortages | Persistent cost pressure |
| ESG compliance costs | Capex increase |
14. Forecast Methodology
The forecast is based on:
- historical recovery curves (post-2020)
- UK tourism projections (VisitBritain trends)
- inflation expectations (Bank of England ranges)
- industry benchmarks (Knight Frank, RSM, STR)
We model three scenarios:
- Base case (most likely)
- Optimistic (strong growth)
- Risk scenario (economic slowdown)
15. Base Case Forecast (2026–2030)
15.1 Core KPI Forecast
| Year | Occupancy | ADR (£) | RevPAR (£) | GOPPAR (£) | Margin |
|---|---|---|---|---|---|
| 2026 | 68% | 140 | 95 | 42 | 36% |
| 2027 | 70% | 145 | 102 | 45 | 37% |
| 2028 | 72% | 150 | 108 | 48 | 38% |
| 2029 | 73% | 155 | 113 | 50 | 39% |
| 2030 | 74% | 160 | 118 | 53 | 40% |
15.2 RevPAR Growth Trend
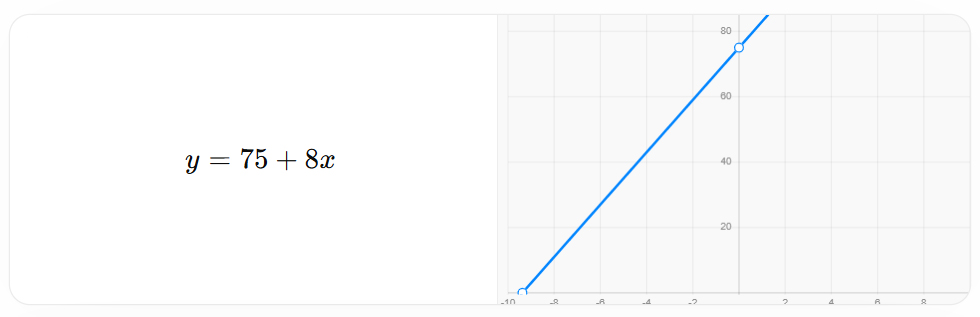
(Simplified linear approximation where x = years after 2025)
Interpretation:
- steady but moderate growth trajectory
- driven by ADR increases + occupancy normalisation
16. Optimistic Scenario
Assumes:
- strong global tourism rebound
- stable costs
- high London demand spillover
| Year | Occupancy | ADR (£) | RevPAR (£) | Margin |
|---|---|---|---|---|
| 2026 | 70% | 145 | 102 | 38% |
| 2027 | 73% | 155 | 113 | 40% |
| 2028 | 75% | 165 | 124 | 42% |
| 2029 | 77% | 175 | 135 | 43% |
| 2030 | 78% | 185 | 144 | 45% |
Result:
- Industry exceeds pre-pandemic profitability
- Strong investor returns
17. Risk Scenario
Assumes:
- economic slowdown
- weak demand
- continued cost pressure
| Year | Occupancy | ADR (£) | RevPAR (£) | Margin |
|---|---|---|---|---|
| 2026 | 62% | 135 | 84 | 32% |
| 2027 | 63% | 138 | 87 | 31% |
| 2028 | 65% | 142 | 92 | 32% |
| 2029 | 67% | 145 | 97 | 33% |
| 2030 | 68% | 148 | 101 | 34% |
Result:
- prolonged margin pressure
- weaker investment attractiveness
18. Segment-Level Forecast
18.1 Performance by Segment (2030 Projection)
| Segment | Growth | Profitability |
|---|---|---|
| Luxury | High | Very high |
| Upper midscale | Stable | Medium-high |
| Budget | Strong demand | Lower margins |
| Independent | Declining | Weak |
19. Investment Outlook
19.1 Yield Expectations
| Segment | Yield (2025) | Forecast (2030) |
|---|---|---|
| London prime | 4.5–5.5% | 4–5% |
| Regional hotels | 6–8% | 5.5–7% |
| Budget chains | 5–6% | 5–6% |
20. Strategic Insights for Investors
20.1 Key Conclusions
- RevPAR will grow steadily, not explosively
- Margins will recover slowly due to cost pressure
- London remains dominant investment hub
- Operational efficiency is critical to profitability
- Technology adoption will define winners
21. Strategic Recommendations
For Hotel Owners
- Invest in automation (reduce labour costs)
- Optimise pricing (dynamic ADR strategies)
- focus on direct bookings (reduce OTA costs)
For Investors
- prioritise London and major cities
- consider repositioning assets
- target luxury and lifestyle segments
22. Key Forecast Summary
| Metric | 2025 | 2030 (Base) |
|---|---|---|
| Occupancy | 56% | 74% |
| ADR | £135 | £160 |
| RevPAR | £75 | £118 |
| Profit margin | 35% | 40% |
VALUATION MODELS, ESG IMPACT, TECHNOLOGY & STRATEGIC FUTURE OF UK HOTEL INDUSTRY
23. Hotel Valuation Framework (UK Market)
Hotel assets are typically valued using three core approaches:
| Method | Description | Use Case |
|---|---|---|
| Income Approach (DCF) | Discounted future cash flows | Primary method |
| Comparable Sales | Market transaction benchmarks | Cross-check |
| Cost Approach | Replacement cost | Secondary |
In the UK, DCF (Discounted Cash Flow) dominates institutional investment decisions.
24. Discounted Cash Flow (DCF) Model – UK Hotel Example
24.1 Core Assumptions (Typical Midscale Hotel)
| Parameter | Value |
|---|---|
| Rooms | 120 |
| Occupancy (stabilised) | 72% |
| ADR | £150 |
| RevPAR | £108 |
| EBITDA margin | 32% |
| Cap rate | 6.5% |
| Discount rate (WACC) | 8.5% |
24.2 Revenue Calculation
Revenue=Rooms×365×Occupancy×ADRRevenue = Rooms \times 365 \times Occupancy \times ADR
Result:
- Annual room revenue ≈ £4.7–5.0 million
24.3 EBITDA Projection
| Year | Revenue (£m) | EBITDA (32%) |
|---|---|---|
| 2026 | 4.8 | 1.54 |
| 2027 | 5.0 | 1.60 |
| 2028 | 5.2 | 1.66 |
| 2029 | 5.4 | 1.73 |
| 2030 | 5.6 | 1.79 |
24.4 Terminal Value Calculation
TV=EBITDA×(1−Tax)CapRateTV = \frac{EBITDA \times (1 – Tax)}{Cap Rate}
Estimated valuation:
- £20–28 million per asset (midscale UK hotel)
25. Investment Sensitivity Analysis
25.1 Key Sensitivities
| Variable | Impact on Value |
|---|---|
| Occupancy ±5% | ±8–12% valuation |
| ADR ±10% | ±15–20% valuation |
| Cap rate ±1% | ±12–18% valuation |
Insight:
ADR is the most powerful value driver
26. ESG Impact on Hotel Profitability
Environmental, Social, and Governance (ESG) factors are becoming central to valuation and operations.
26.1 ESG Cost vs Benefit Analysis
| Factor | Cost Impact | Long-term Benefit |
|---|---|---|
| Energy efficiency upgrades | High CAPEX | Lower OPEX |
| Net-zero compliance | Moderate | Investor attractiveness |
| Staff welfare policies | Moderate | Retention & productivity |
| Sustainable sourcing | Low-moderate | Brand value |
26.2 Energy Efficiency Example
- Hotels reducing energy consumption by 20–30% can:
- improve margins by 2–4 percentage points
- increase asset value by 5–10%
27. Technology Transformation in UK Hotels
27.1 Key Technologies Driving Profitability
| Technology | Impact |
|---|---|
| AI pricing (revenue management) | +5–10% ADR |
| Self check-in | ↓ labour costs |
| Smart energy systems | ↓ utilities |
| CRM & personalisation | ↑ repeat guests |
| Cloud PMS systems | operational efficiency |
27.2 ROI from Technology Investment
| Investment | Payback Period |
|---|---|
| AI pricing tools | 6–12 months |
| Automation systems | 1–2 years |
| Energy systems | 2–4 years |
Conclusion:
Technology is no longer optional — it is a core profitability lever.
28. Structural Shifts in the UK Hotel Market
28.1 Key Long-Term Trends
| Trend | Impact |
|---|---|
| Rise of branded hotels | Consolidation |
| Decline of independents | Margin pressure |
| Hybrid hospitality (co-living, extended stay) | New revenue streams |
| Experience-driven travel | Premium pricing |
29. London vs Regional Outlook (Strategic View)
29.1 Strategic Positioning
| Factor | London | Regions |
|---|---|---|
| Demand | Global | Domestic |
| Pricing power | Very high | Moderate |
| Investment appeal | Strong | Selective |
| Risk | Lower | Higher |
Conclusion:
- London = core institutional market
- Regions = opportunistic / value-add plays
30. Case Study: Typical UK Hotel Investment Strategy
Scenario: Value-Add Acquisition
| Step | Action |
|---|---|
| 1 | Acquire underperforming asset |
| 2 | Renovate & reposition |
| 3 | Implement tech + pricing optimisation |
| 4 | Improve ADR & occupancy |
| 5 | Exit at lower cap rate |
Typical IRR: 12–18%
31. Future Profitability Drivers (2026–2030)
Top 5 Drivers
- Pricing power (ADR optimisation)
- Cost efficiency (automation + energy)
- Brand strength
- Direct booking channels
- Experience-led offerings
32. Strategic Risks to Monitor
| Risk | Probability | Impact |
|---|---|---|
| Economic slowdown | Medium | High |
| Labour shortages | High | High |
| Regulation (tax, ESG) | Medium | Medium |
| Oversupply in some regions | Low-medium | Medium |
33. Final Strategic Recommendations (Executive Level)
For Investors
- Focus on:
- London
- luxury & lifestyle segments
- Use:
- value-add strategies
- operational optimisation
For Operators
- Invest in:
- automation
- AI pricing systems
- Reduce:
- OTA dependency
- Enhance:
- guest experience
34. Final Industry Outlook (2030 Vision)
By 2030, the UK hotel sector is expected to be:
- Fully stabilised post-pandemic
- More technology-driven
- More cost-efficient
- Increasingly institutionalised
35. Final Conclusion
The UK hotel industry presents a compelling but complex investment landscape.
Key Takeaways:
- Strong demand fundamentals
- Moderate revenue growth
- Margin pressure remains key challenge
- Technology & ESG will define future winners
The sector is moving from recovery → optimisation → transformation