

Company Formations vs Closures: Is the UK Creating Businesses Faster Than It Loses Them?
The UK is still registering more new companies than it is dissolving, but the gap between the two has narrowed dramatically.
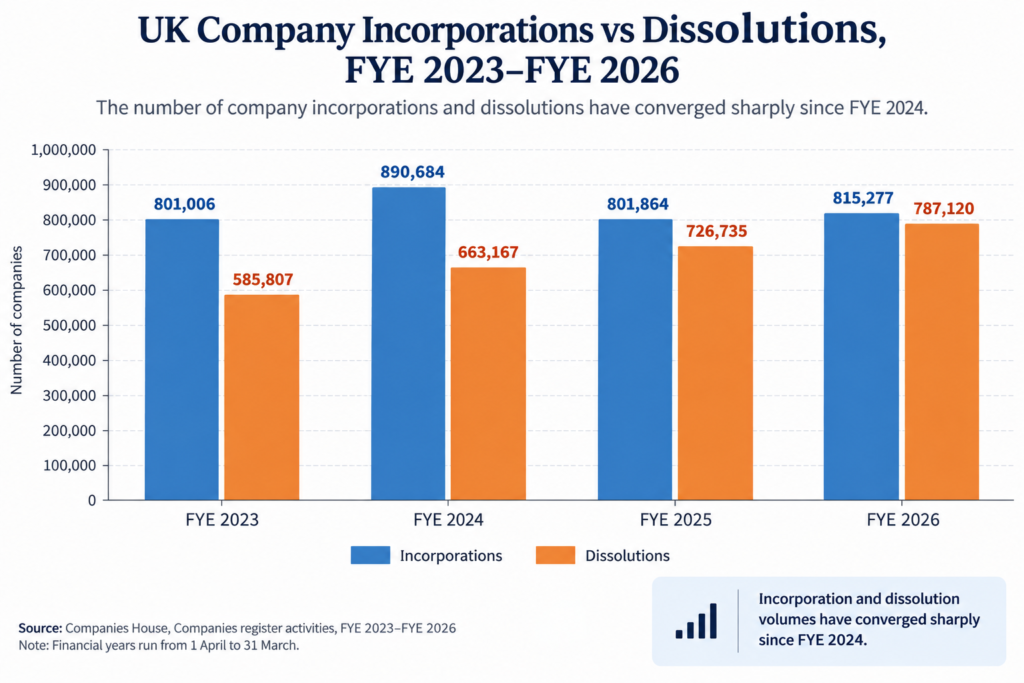
Companies House recorded 815,277 company incorporations in the financial year ending (FYE) March 2026, compared with 787,120 dissolutions. That leaves a simple difference of just 28,157.
The longer-term shift is more striking. Audit Consulting Group analysis of Companies House data shows that the incorporation-minus-dissolution gap stood at 227,517 in FYE 2024. By FYE 2026, it had contracted by approximately 87.6%.
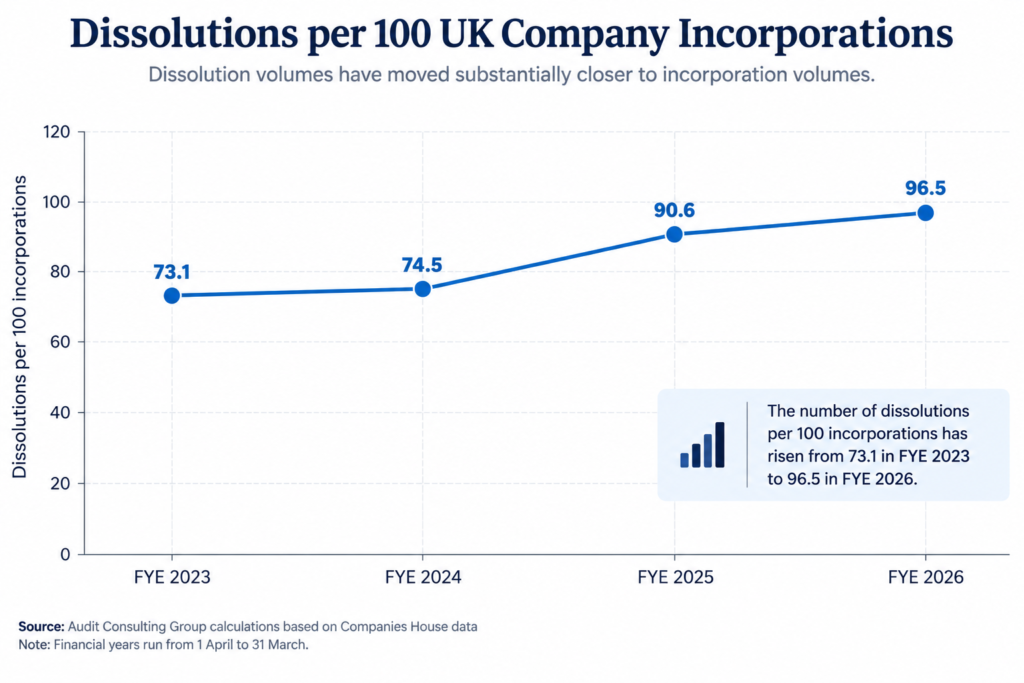
There were also around 96.5 dissolutions for every 100 incorporations in FYE 2026, compared with 74.5 two years earlier.
But this does not mean the UK lost almost as many active businesses as it created. Company incorporations and dissolutions are legal-register events. The Office for National Statistics (ONS) uses a different methodology to measure births and deaths within the population of active businesses.
On that measure, the picture is different: ONS recorded approximately 317,000 business births and 280,000 business deaths in 2024.
This analysis therefore examines both statistical systems separately to answer a deceptively simple question: is the UK creating businesses faster than it is losing them?
Data and sources were checked up to 19 September 2026.
UK company formations vs closures: key statistics
- Companies House recorded 815,277 incorporations in FYE 2026.
- There were 787,120 dissolutions over the same financial year.
- The simple incorporation-minus-dissolution difference was 28,157.
- The equivalent difference was 227,517 in FYE 2024, meaning the gap contracted by approximately 87.6% in two years.
- There were approximately 96.5 dissolutions per 100 incorporations in FYE 2026.
- Dissolutions increased by 8.31% year on year, compared with incorporation growth of 1.67%.
- ONS recorded approximately 317,000 business births and 280,000 business deaths in 2024.
- The ONS business birth rate was 11.1%, while the provisional death rate was 9.8%.
815,277 companies were incorporated while 787,120 were dissolved
Companies House recorded 815,277 incorporations during FYE 2026, up 1.67% from the previous financial year. Dissolutions rose considerably faster, increasing 8.31% to 787,120.
The resulting difference between the two flows was 28,157.
| Financial year | Incorporations | Dissolutions | Simple difference | Dissolutions per 100 incorporations |
|---|---|---|---|---|
| FYE 2023 | 801,006 | 585,807 | 215,199 | 73.1 |
| FYE 2024 | 890,684 | 663,167 | 227,517 | 74.5 |
| FYE 2025 | 801,864 | 726,735 | 75,129 | 90.6 |
| FYE 2026 | 815,277 | 787,120 | 28,157 | 96.5 |
Source: Companies House. Simple differences and dissolutions per 100 incorporations are Audit Consulting Group calculations based on Companies House data.
The pattern changed substantially after FYE 2024. The difference remained above 200,000 in FYE 2023 and FYE 2024, before falling to 75,129 in FYE 2025 and just 28,157 in FYE 2026.
That is not the same as saying that only 28,157 companies were added to the register, or that the UK created 28,157 net new businesses. Both require different measures.
The gap between incorporations and dissolutions has contracted by 87.6% in two years
In FYE 2024, Companies House recorded 890,684 incorporations and 663,167 dissolutions, leaving a difference of 227,517.
By FYE 2026, that difference had fallen to 28,157.
Audit Consulting Group analysis of Companies House data therefore finds that the incorporation-minus-dissolution gap contracted by approximately 87.6% between FYE 2024 and FYE 2026.
The movement reflects different trends on each side of the register. Incorporations fell sharply after their FYE 2024 level before returning to modest growth in FYE 2026. Dissolutions, meanwhile, continued to increase.
In the latest financial year alone, dissolution growth of 8.31% was almost five times the 1.67% rate of incorporation growth.
The UK recorded 96.5 dissolutions for every 100 incorporations
Another way to see the convergence is to compare dissolution volumes with every 100 incorporations.
Audit Consulting Group calculations show that the ratio increased from approximately 73.1 dissolutions per 100 incorporations in FYE 2023 to 96.5 in FYE 2026.
| Financial year | Dissolutions per 100 incorporations |
|---|---|
| FYE 2023 | 73.1 |
| FYE 2024 | 74.5 |
| FYE 2025 | 90.6 |
| FYE 2026 | 96.5 |
Source: Audit Consulting Group calculations based on Companies House incorporation and dissolution figures.
This ratio is not a company failure rate or survival rate. The companies dissolved during FYE 2026 are not necessarily those incorporated during the same year.
It is instead a way of comparing the scale of two separate legal-register flows.
Why 815,277 minus 787,120 does not equal growth in the companies register
Subtracting dissolutions from incorporations produces 28,157, but Companies House reports that the total register actually increased by 51,258 companies, or 0.94%, during FYE 2026 to reach 5,479,045.
The apparent discrepancy has a methodological explanation.
Companies House notes that when a company is struck off, it is removed from the register immediately but is not legally dissolved until a second notice is published in the relevant Gazette. A strike-off can therefore affect register size in one period while the corresponding dissolution is recorded in another.
Restorations and other movements can also affect register totals.
The 28,157 figure should therefore be described as the simple difference between incorporations and dissolutions, not official register growth and not net UK business creation.
A company incorporation is not the same as a business birth
There is an even more important distinction when assessing whether Britain is creating businesses faster than it loses them.
A Companies House incorporation records the legal registration of a company. It does not necessarily mean that the company immediately starts trading, employs people or generates turnover.
Likewise, a company dissolution is a legal-register event. It should not automatically be described as the failure or closure of an economically active business.
ONS Business Demography uses the Inter-Departmental Business Register to measure births and deaths within the active business population.
| Measure | Source | What it measures |
|---|---|---|
| Company incorporation | Companies House | Legal registration of a company |
| Company dissolution | Companies House | Legal dissolution and removal from the companies register |
| Business birth | ONS Business Demography / IDBR | Entry of an active enterprise into the business population under ONS methodology |
| Business death | ONS Business Demography / IDBR | An enterprise ceasing activity under ONS business-demography methodology |
Sources: Companies House and Office for National Statistics. These measures represent different populations and should not be treated as interchangeable.
This distinction is central to interpreting UK company formation and business closure statistics correctly.
ONS recorded 317,000 business births and 280,000 deaths in 2024
The latest annual ONS Business Demography data provide a different perspective.
Approximately 317,000 business births were recorded in 2024, compared with 316,000 in 2023. The business birth rate edged up from 11.0% to 11.1%.
Business deaths moved in the opposite direction. ONS recorded approximately 280,000 deaths in 2024, with the death rate falling from 10.8% in 2023 to 9.8% in 2024.
ONS states that the 2023 and 2024 death counts are provisional.
| Year | Active businesses (000s) | Births (000s) | Birth rate | Deaths (000s) | Death rate |
|---|---|---|---|---|---|
| 2019 | 2,889 | 364 | 12.6% | 303 | 10.5% |
| 2020 | 2,897 | 333 | 11.5% | 300 | 10.4% |
| 2021 | 2,940 | 364 | 12.4% | 328 | 11.2% |
| 2022 | 2,925 | 337 | 11.5% | 345 | 11.9% |
| 2023 | 2,870 | 316 | 11.0% | 309 | 10.8% |
| 2024 | 2,860 | 317 | 11.1% | 280 | 9.8% |
Source: Office for National Statistics, Business Demography, UK: 2024. Headline counts are rounded to the nearest thousand. Death counts for 2023 and 2024 are provisional.
Using the rounded headline figures, business births exceeded deaths by approximately 37,000 in 2024.
That difference should itself be treated as approximate because ONS publishes the figures in this table to the nearest thousand.
The historical series also demonstrates why a positive balance should not be assumed. In 2022, approximately 337,000 births were recorded against 345,000 deaths.
The ONS birth-to-death rate gap widened to 1.3 percentage points
The ONS rates show a marked change between 2023 and 2024.
In 2023, the business birth rate of 11.0% was only 0.2 percentage points above the 10.8% death rate.
By 2024, the birth rate had edged up to 11.1% while the death rate fell to 9.8%, widening the difference to 1.3 percentage points.
This creates an important contrast with the Companies House statistics. The legal-register gap between incorporations and dissolutions has narrowed sharply, while the latest annual ONS data show the gap between active-business birth and death rates widening.
Those findings are not contradictory. The datasets use different definitions, populations and reporting periods.
Every UK region had a higher business birth rate than death rate in 2024
ONS regional data show that the positive national birth-to-death balance was geographically widespread.
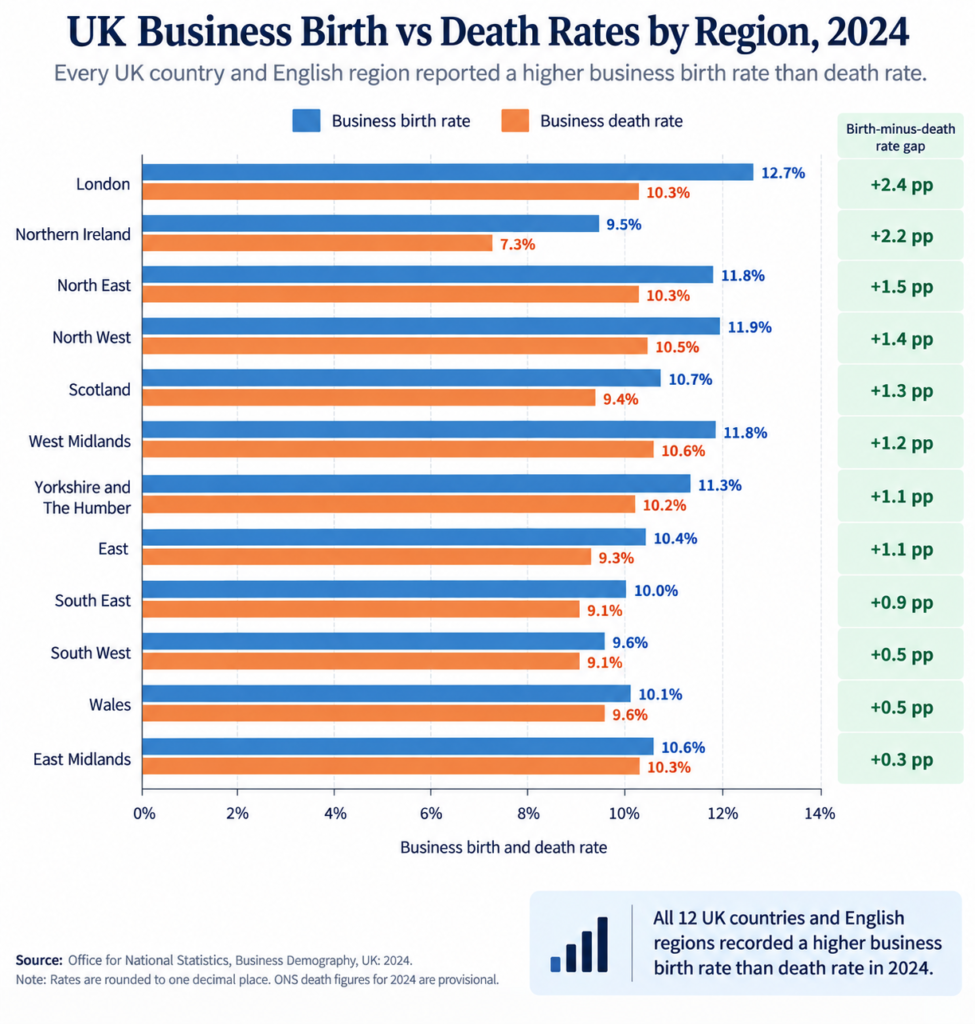
Across all 12 countries and English regions reported by ONS, the business birth rate exceeded the death rate in 2024.
| Region | Birth rate | Death rate | Birth-minus-death rate gap |
|---|---|---|---|
| London | 12.7% | 10.3% | +2.4 pp |
| Northern Ireland | 9.5% | 7.3% | +2.2 pp |
| North East | 11.8% | 10.3% | +1.5 pp |
| North West | 11.9% | 10.5% | +1.4 pp |
| Scotland | 10.7% | 9.4% | +1.3 pp |
| West Midlands | 11.8% | 10.6% | +1.2 pp |
| Yorkshire and The Humber | 11.3% | 10.2% | +1.1 pp |
| East | 10.4% | 9.3% | +1.1 pp |
| South East | 10.0% | 9.1% | +0.9 pp |
| South West | 9.6% | 9.1% | +0.5 pp |
| Wales | 10.1% | 9.6% | +0.5 pp |
| East Midlands | 10.6% | 10.3% | +0.3 pp |
Source: Office for National Statistics, Business Demography, UK: 2024. Rate gaps are Audit Consulting Group calculations. ONS death figures for 2024 are provisional.
London recorded the highest birth rate at 12.7%. With a death rate of 10.3%, its positive spread was 2.4 percentage points — the widest among the 12 regions.
Northern Ireland had a relatively low birth rate of 9.5%, but its 7.3% death rate produced the second-largest positive spread, at 2.2 percentage points.
The East Midlands had the narrowest positive gap, at 0.3 percentage points.
A high business birth rate does not necessarily mean businesses are accumulating faster
The industry data provide one of the clearest examples of why formation statistics need context.
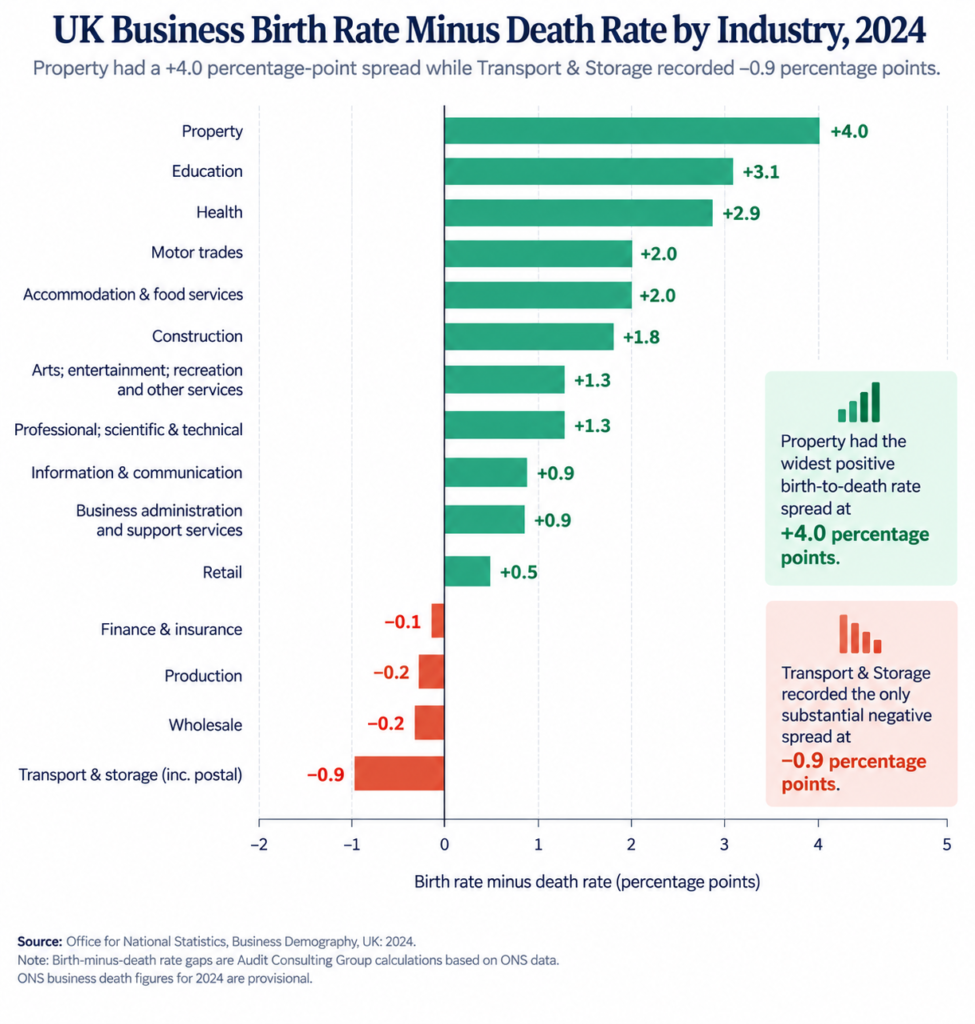
Transport and storage, including postal activities, recorded the highest business birth rate among the 15 broad ONS industry groups in 2024 at 15.6%. Its death rate, however, was even higher at 16.5%.
Audit Consulting Group analysis therefore gives the sector a birth-minus-death rate gap of −0.9 percentage points.
| Industry | Birth rate | Death rate | Birth-minus-death rate gap |
|---|---|---|---|
| Property | 10.2% | 6.2% | +4.0 pp |
| Education | 10.6% | 7.5% | +3.1 pp |
| Health | 9.4% | 6.5% | +2.9 pp |
| Motor trades | 9.2% | 7.2% | +2.0 pp |
| Accommodation & food services | 14.9% | 12.9% | +2.0 pp |
| Construction | 10.6% | 8.8% | +1.8 pp |
| Arts; entertainment; recreation and other services | 9.7% | 8.4% | +1.3 pp |
| Professional; scientific & technical | 10.5% | 9.2% | +1.3 pp |
| Information & communication | 10.7% | 9.8% | +0.9 pp |
| Business administration and support services | 14.4% | 13.5% | +0.9 pp |
| Retail | 11.4% | 10.9% | +0.5 pp |
| Finance & insurance | 6.6% | 6.7% | −0.1 pp |
| Production | 7.6% | 7.8% | −0.2 pp |
| Wholesale | 8.7% | 8.9% | −0.2 pp |
| Transport & storage (inc. postal) | 15.6% | 16.5% | −0.9 pp |
Source: Office for National Statistics, Business Demography, UK: 2024. Rate gaps are Audit Consulting Group calculations. ONS death figures are provisional.
Property shows the opposite pattern. Its 10.2% birth rate was well below the fastest-forming sectors, but its death rate was only 6.2%. That produced a positive spread of 4.0 percentage points, the widest among these broad industry groups.
Education followed at +3.1 percentage points and health at +2.9 percentage points.
Meanwhile, four broad sectors had death rates above birth rates: transport and storage, production, wholesale, and finance and insurance.
The comparison demonstrates why the number or rate of new businesses alone does not describe the direction of an industry’s business population.
So, is the UK creating businesses faster than it loses them?
The latest official statistics show more creation than closure on both measures examined here, but the scale and direction of the trend depend on the dataset.
Companies House recorded more incorporations than dissolutions in FYE 2026: 815,277 compared with 787,120. Yet the difference between those flows has contracted by approximately 87.6% since FYE 2024.
ONS Business Demography, meanwhile, recorded approximately 317,000 business births against 280,000 deaths in 2024. Its business birth rate exceeded the death rate by 1.3 percentage points, wider than the 0.2 percentage-point spread in 2023.
The two findings answer different questions.
Companies House statistics show what is happening to registered legal entities. ONS Business Demography provides evidence about births and deaths within the active enterprise population.
Neither supports treating every incorporation as a newly trading business or every dissolution as a business failure.
What the narrowing Companies House gap tells us — and what it does not
The Companies House trend is nevertheless significant.
Legal-register flows have moved much closer together: from 74.5 dissolutions per 100 incorporations in FYE 2024 to 96.5 in FYE 2026.
Companies House introduced identity verification as a legal requirement on 18 November 2025 and increased incorporation and registration fees on 1 February 2026. Both developments occurred during FYE 2026.
The statistics alone do not establish that either change caused the observed movement in incorporations or dissolutions, so they should not be treated as causal explanations.
There is also a statistical-series consideration. Companies House states that the FYE 2026 publication is the final annual Official Statistics release in its current format. New statistics are being developed to reflect changes in data availability and methodology.
Future comparisons should therefore check whether definitions or statistical methods have changed before extending the historical series.
Methodology and limitations
This analysis combines two separate official statistical systems and does not treat them as interchangeable.
Companies House data cover company-register activity and are reported by financial year from 1 April to 31 March. The main historical comparison covers FYE 2023 to FYE 2026.
ONS Business Demography data use the Inter-Departmental Business Register and are reported by calendar year. The latest annual release analysed here covers 2024.
Audit Consulting Group calculations include:
- annual incorporation-minus-dissolution differences;
- the percentage contraction in that difference between FYE 2024 and FYE 2026;
- dissolutions per 100 incorporations;
- regional birth-minus-death rate differences; and
- industry birth-minus-death rate differences.
Calculated values use source-published figures and are rounded where appropriate.
ONS publishes the headline business birth and death counts used in the historical table to the nearest thousand. Derived differences based on those rounded values should therefore be interpreted as approximate. ONS also identifies the 2023 and 2024 business death counts as provisional.
Companies House identifies timing differences between strike-off and legal dissolution that can cause changes in register size and dissolution counts to fall into different reporting periods. Consequently, incorporations minus dissolutions should not be interpreted as official register growth.
Companies House also states that the FYE 2026 annual release is the final publication in its current statistical format. Future updates to this analysis should review methodological changes before making direct historical comparisons.
Finally, incorporation and dissolution statistics should not be combined directly with ONS business births and deaths to create a single net-business measure. They describe different concepts and populations.
What to watch next
The next releases will show whether the convergence between company incorporations and dissolutions persists, reverses or develops differently under Companies House’s revised statistical programme.
Future ONS Business Demography data will answer a separate question: whether the wider positive gap between active-business birth and death rates seen in 2024 continues once newer and revised estimates become available.
For anyone tracking UK business creation, the most useful approach is therefore not to rely on a single headline formation number. Companies House and ONS statistics are most informative when read together — while preserving the distinction between the events each dataset actually measures.