

UK Company Formation Statistics 2026: Where Are New Companies Being Created?
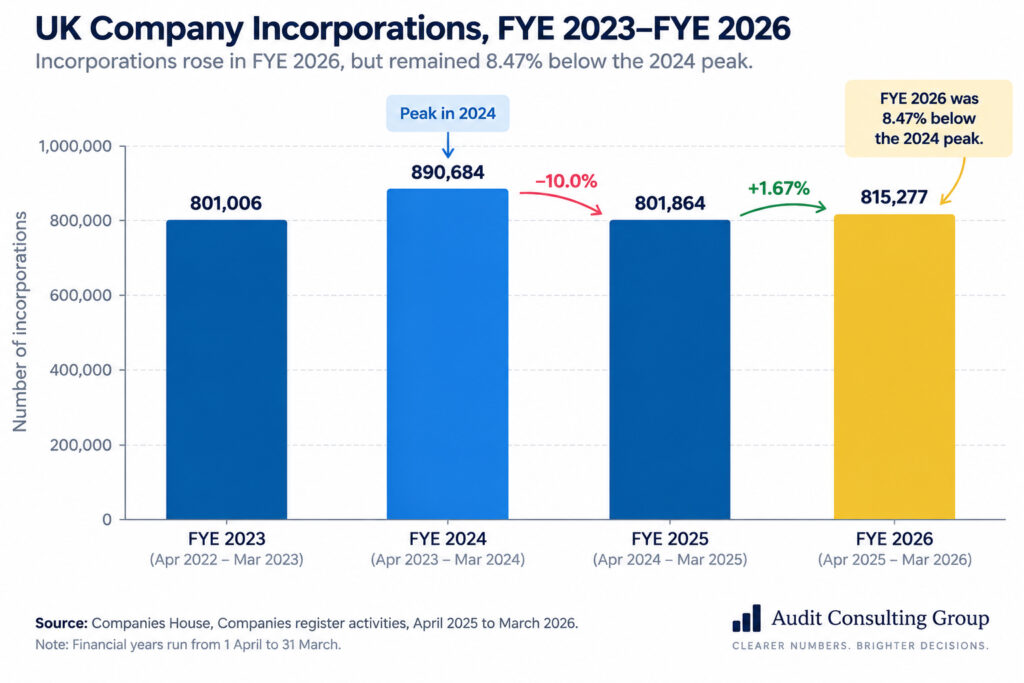
The UK recorded 815,277 company incorporations in the financial year ending March 2026, according to Companies House. That was 13,413 more than the previous financial year, an increase of 1.67%.
But the annual recovery tells only part of the story. Audit Consulting Group analysis of Companies House data shows that incorporations remained approximately 8.47% below their FYE 2024 level. The latest quarterly figures also weakened: 192,287 companies were incorporated between April and June 2026, around 8.35% fewer than in the same quarter a year earlier.
Leave your details and our team will get back to you shortly.
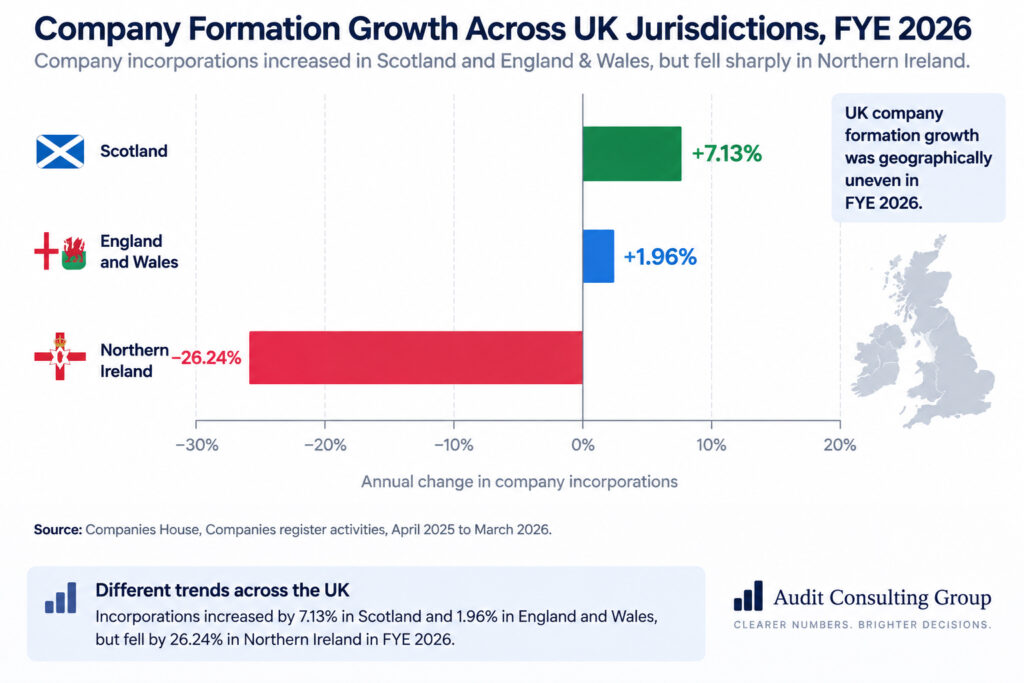
The geographic picture is equally uneven. Scotland recorded a 7.13% annual increase in incorporations, compared with 1.96% in England and Wales, while Northern Ireland recorded a 26.24% decline.
This analysis brings together the latest Companies House incorporation and register statistics with Office for National Statistics business-demography data to examine where new companies are being created, how formation activity has changed and why company incorporations should not be treated as equivalent to new actively trading businesses.
Data and sources were checked up to 17 September 2026.
UK Company Formation Statistics 2026: Key Findings
- 815,277 companies were incorporated in FYE 2026, up 1.67% year on year.
- Annual incorporations remained approximately 8.47% below FYE 2024, according to Audit Consulting Group analysis.
- 192,287 companies were incorporated between April and June 2026, around 8.35% fewer than during the same quarter of 2025.
- Scotland recorded a 7.13% annual increase in incorporations, compared with 1.96% in England and Wales.
- Northern Ireland moved in the opposite direction, with incorporations falling 26.24%.
- 787,120 companies were dissolved in FYE 2026, 8.31% more than a year earlier.
- The total UK companies register reached 5,479,045 companies at 31 March 2026 and 5,516,377 by the end of June.
- ONS recorded approximately 317,000 business births in 2024, with London having the highest regional business-birth rate at 12.7%.
815,277 UK Companies Were Incorporated in FYE 2026
Companies House data for FYE 2026 show that 815,277 companies were incorporated between 1 April 2025 and 31 March 2026.
This represented an increase of 13,413 incorporations, or 1.67%, from the 801,864 recorded in FYE 2025. The recovery followed a much sharper decline in the preceding year, when incorporations fell 10.0% from 890,684 in FYE 2024.
| Financial year | Company incorporations | Annual change |
|---|---|---|
| FYE 2023 | 801,006 | — |
| FYE 2024 | 890,684 | +11.2% |
| FYE 2025 | 801,864 | −10.0% |
| FYE 2026 | 815,277 | +1.67% |
Source: Companies House annual companies register statistics. Annual changes are Companies House figures where reported.
The longer comparison changes the interpretation of the latest annual increase. Audit Consulting Group calculates that FYE 2026 incorporations were still approximately 8.47% below FYE 2024: (815,277 − 890,684) ÷ 890,684 × 100.
FYE 2026 therefore represents a partial recovery in incorporation activity rather than a return to the level recorded two years earlier.
The Latest 2026 Data Show a Renewed Slowdown
The annual increase is not yet reflected in the most recent quarterly figures.
Companies House recorded 192,287 incorporations between April and June 2026. The equivalent quarter in 2025 recorded 209,798.
Audit Consulting Group calculates that this represents a year-on-year decline of approximately 8.35%.
| Quarter | Incorporations | Quarter-on-quarter change |
|---|---|---|
| Apr–Jun 2025 | 209,798 | — |
| Jul–Sep 2025 | 215,982 | +2.95% |
| Oct–Dec 2025 | 184,888 | −14.40% |
| Jan–Mar 2026 | 204,612 | +10.67% |
| Apr–Jun 2026 | 192,287 | −6.02% |
Source: Companies House quarterly releases. Quarter-on-quarter percentages shown in this table are Audit Consulting Group calculations based on published incorporation totals.
The quarterly series has been volatile. Incorporations rose during July–September 2025, fell sharply in the following quarter, recovered during January–March 2026 and then declined again.
Between January–March and April–June 2026 alone, incorporation activity fell approximately 6.02%.
This is an important qualification to the annual headline. FYE 2026 as a whole recorded modest growth, but the latest available quarter was weaker both sequentially and compared with the same period a year earlier.
Companies House’s April–June 2026 release is also the first quarterly publication under a new reporting format. Companies House now publishes monthly figures alongside quarterly totals and changed how additions and removals reconcile with movements in the size of the register. Comparisons involving register movements should therefore be interpreted with this methodological change in mind.
Where Are New UK Companies Being Created?
The FYE 2026 data show substantial differences between the UK’s three Companies House jurisdictions.
| Jurisdiction | Change in incorporations | Annual change |
|---|---|---|
| England and Wales | +14,644 | +1.96% |
| Scotland | +2,731 | +7.13% |
| Northern Ireland | −3,962 | −26.24% |
Source: Companies House, Companies register activities FYE 2026. Values are directly reported changes from FYE 2025.
Scotland recorded the strongest percentage growth, with incorporations increasing 7.13%. England and Wales, which account for the majority of UK company registrations, recorded a more modest 1.96% increase.
Northern Ireland moved sharply in the opposite direction: incorporations were 3,962 lower than in FYE 2025, a decline of 26.24%.
The comparison does not by itself establish why incorporation activity diverged. It does, however, show that the UK’s modest overall annual recovery was not geographically uniform.
Regional Business Births Provide a Different View
Companies House does not provide the same local and regional incorporation breakdown needed for a detailed comparison of English regions. For this purpose, Office for National Statistics business-demography data provide a useful second lens.
However, these datasets measure different things.
The latest ONS Business Demography release recorded approximately 317,000 business births across the UK in 2024, based on the Inter-Departmental Business Register.
| Region | Business births | Birth rate |
|---|---|---|
| London | 76,000 | 12.7% |
| South East | 43,000 | 10.0% |
| North West | 34,000 | 11.9% |
| East | 30,000 | 10.4% |
| West Midlands | 27,000 | 11.8% |
| Yorkshire and The Humber | 23,000 | 11.3% |
| South West | 22,000 | 9.6% |
| East Midlands | 20,000 | 10.6% |
| Scotland | 18,000 | 10.7% |
| Wales | 10,000 | 10.1% |
| North East | 9,000 | 11.8% |
| Northern Ireland | 6,000 | 9.5% |
| UK | 317,000 | 11.1% |
Source: Office for National Statistics, Business Demography 2024, Inter-Departmental Business Register. Counts are rounded to the nearest thousand.
London recorded by far the largest number of business births, at approximately 76,000. Population and business-stock size matter, however, so raw totals should not be interpreted as a direct measure of entrepreneurial intensity.
The ONS birth rate provides useful context. London also had the highest rate, at 12.7%, followed by the North West at 11.9%, while the North East and West Midlands each recorded 11.8%.
The South East illustrates why totals and rates answer different questions. It recorded the second-highest number of births, around 43,000, but a birth rate of 10.0%.
815,277 Incorporations Does Not Mean 815,277 New Businesses Started Trading
This distinction is essential when interpreting UK company formation statistics.
Companies House counts companies incorporated under company law. Companies are registered regardless of whether they subsequently begin active trading.
ONS business births are based on a different statistical framework and business population. A business birth generally reflects an enterprise becoming active on the Inter-Departmental Business Register rather than simply acquiring a Companies House registration.
| Measure | Latest figure used | Period | What it broadly measures |
|---|---|---|---|
| Companies House incorporations | 815,277 | FYE 2026 | Companies legally incorporated |
| ONS business births | 317,000 | 2024 | Businesses becoming active within the ONS business-demography framework |
Sources: Companies House and Office for National Statistics. The figures refer to different periods, definitions and statistical populations and should not be directly subtracted or treated as equivalent.
The gap between the two numbers is therefore not evidence that hundreds of thousands of companies “failed to start”. It largely reflects different definitions, coverage and reference periods.
For anyone using formation statistics to assess entrepreneurship or economic activity, incorporation data are useful but should not be treated as a standalone proxy for new active businesses.
Company Dissolutions Rose Much Faster Than Incorporations
Formation activity is only one side of the companies register.
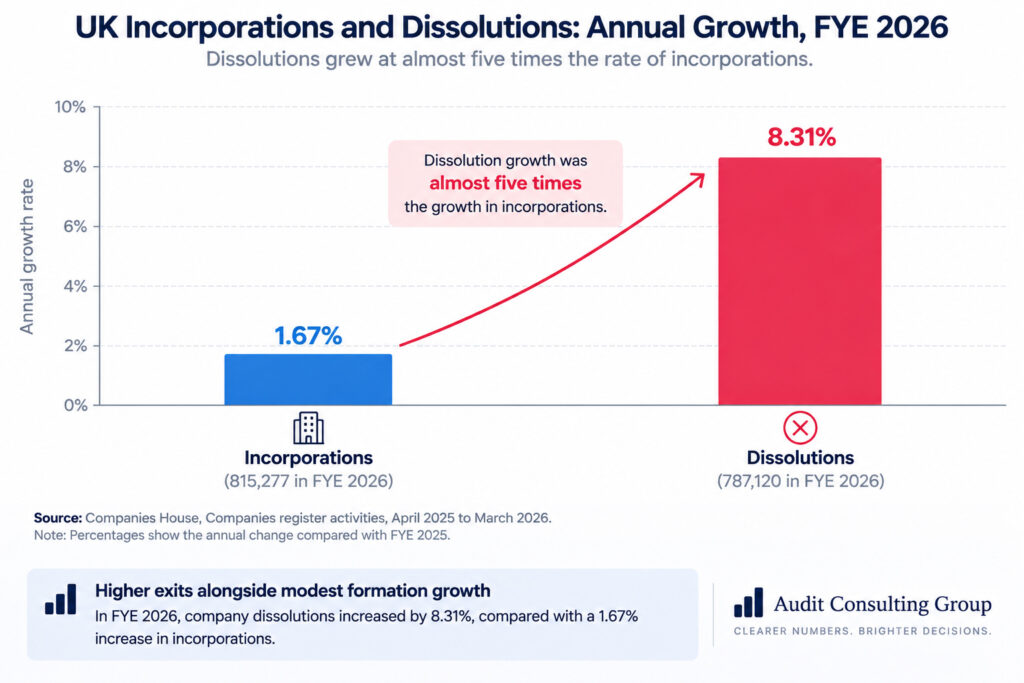
Companies House recorded 787,120 dissolutions in FYE 2026, an increase of 8.31% from the previous financial year. Over the same period, incorporations increased by only 1.67%.
| Measure | FYE 2026 | Annual change |
|---|---|---|
| Incorporations | 815,277 | +1.67% |
| Dissolutions | 787,120 | +8.31% |
Source: Companies House, FYE 2026. Audit Consulting Group comparison: 8.31 ÷ 1.67 ≈ 4.98.
In percentage terms, dissolutions therefore grew at almost five times the rate of incorporations.
This comparison should not be interpreted as a business-failure rate. Companies can be dissolved for many reasons, and dissolution is not synonymous with insolvency.
It does, however, provide an important counterweight to the headline increase in company formation. The register was experiencing substantial activity at both entry and exit.
Why Did the Companies Register Still Grow?
At first glance, 815,277 incorporations minus 787,120 dissolutions produces a difference of 28,157. Yet Companies House reported that the total register grew by 51,258 companies during FYE 2026, reaching 5,479,045 companies at 31 March 2026.
The figures are not contradictory.
Companies House explains that register movements are affected by restorations, other additions and removals, as well as timing differences between a company being struck off the register and becoming legally dissolved. A company can be struck off in one period but legally dissolved in another.
For this reason, simple subtraction of annual incorporations and dissolutions should not be used as a substitute for the official change in register size.
The effective register, which excludes companies in the process of dissolution or liquidation, stood at 4,930,634 at the end of FYE 2026.
The Register Reached 5.52 Million Companies by June 2026
The first quarter of the new financial year pushed the register higher again.
By the end of June 2026, Companies House reported 5,516,377 companies on the register, with a net increase of 37,339 during the quarter.
There were 192,287 incorporations during April–June, alongside 156,515 companies struck off and dissolved within the period.
Companies House also noted an operational factor affecting the June figures: some online services were unavailable between 12 and 16 June 2026, resulting in fewer companies being struck off than expected during that month.
This is another reason to interpret short-term register movements cautiously rather than assuming every quarterly movement reflects a change in underlying business conditions.
Company Formation in 2026: Recovery, but Not a Return to the Peak
Taken together, the latest statistics present a more nuanced picture than the annual growth rate alone suggests.
FYE 2026 produced 815,277 incorporations and returned annual company formation to growth after the sharp decline recorded in FYE 2025. Yet Audit Consulting Group analysis shows that formations remained approximately 8.47% below FYE 2024, while the latest April–June 2026 quarter was approximately 8.35% weaker than a year earlier.
Geography also matters. Scotland recorded substantially stronger annual incorporation growth than England and Wales, while Northern Ireland experienced a sizeable decline.
At the same time, dissolutions increased much faster than incorporations. That does not imply a corresponding rise in business failures, but it reinforces the need to analyse formation statistics alongside exits, register movements and measures of active businesses.
For businesses considering incorporation, the statistical environment does not change the need to get the structure and registration process right. More information on the practical requirements is available in our UK company formation guide and service and our broader company formation and corporate governance guidance.
Methodology
This analysis was prepared by Audit Consulting Group using Companies House official statistics and Office for National Statistics Business Demography data. Sources were checked up to 17 September 2026.
Annual Companies House figures use financial years running from 1 April to 31 March. The latest complete annual period analysed is FYE 2026. Quarterly Companies House figures extend the analysis to April–June 2026.
ONS regional business-birth figures relate to calendar year 2024 and use the Inter-Departmental Business Register. They are included to provide regional context but are not treated as equivalent to Companies House incorporations.
Audit Consulting Group calculations include percentage changes between published values, the comparison between FYE 2026 and FYE 2024 incorporations, quarterly changes and the ratio between the published annual growth rates of dissolutions and incorporations. Calculated percentages are rounded to two decimal places where appropriate.
The April–June 2026 Companies House release introduced a new publication format and changes to how additions and removals reconcile with changes in register size. Companies House administrative statistics may also be revised when underlying records or methods are corrected.
Important limitations
- A company incorporation does not establish that the company subsequently traded.
- Companies House incorporations and ONS business births measure different populations and events.
- ONS regional birth counts are rounded to the nearest thousand.
- Annual and quarterly data cover different reference periods.
- Changes in incorporation activity do not by themselves establish why more or fewer companies were formed.
- Dissolution should not be interpreted as synonymous with business failure or insolvency.
- Companies House changed the format and aspects of the methodology of its quarterly statistics from April–June 2026.