

UK Company Insolvency Statistics 2026: Which Industries Are Under the Most Pressure?
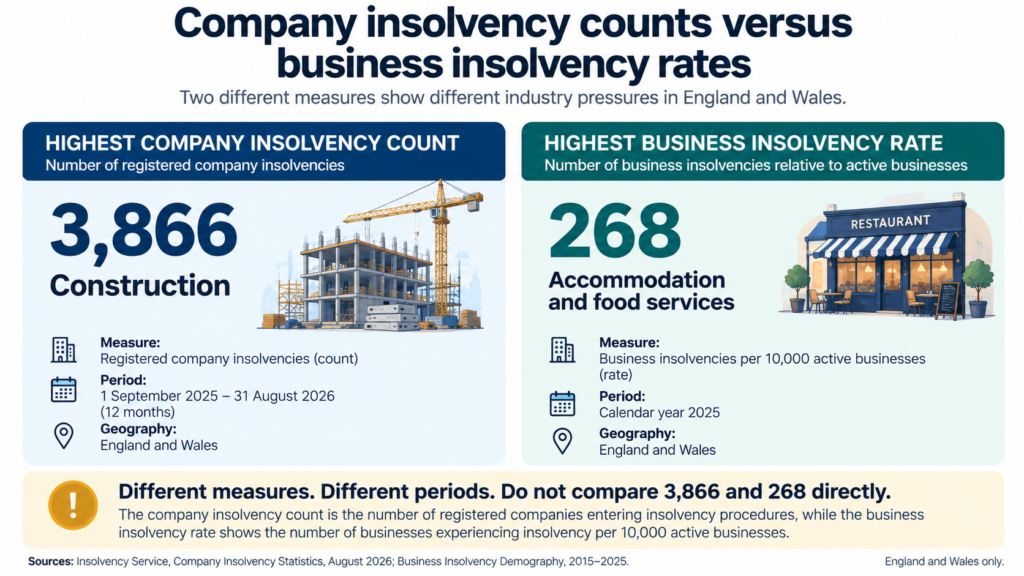
Construction recorded the highest number of company insolvencies in England and Wales in the 12 months to August 2026, but hospitality had the highest relative business insolvency rate in the latest available annual industry data. The distinction matters: the sector with the most failed companies is not necessarily the sector where an individual business faces the greatest insolvency risk.
Scope: The detailed rankings below relate to England and Wales, not an aggregated UK-wide sector ranking. Two official statistical series are used: monthly registered-company insolvencies and annual business insolvency demography. They have different denominators and must not be directly equated.
According to the Insolvency Service’s August 2026 statistics, 1,946 companies entered formal insolvency procedures in England and Wales during August. That was approximately 3% fewer than in August 2025, despite continuing pressure across construction, retail, hospitality and other major industries.
Audit Consulting Group examined the latest company insolvency statistics, sector-level data, historical trends and the government’s Business Insolvency Demography research to identify where insolvencies are concentrated, how relative risks differ and what the figures reveal about the financial position of UK businesses.
Research cut-off: 15 October 2026. The latest monthly figures cover August 2026. The latest detailed annual business insolvency rates by industry cover 2025. Most comparisons in this analysis concern England and Wales, with separate figures for Scotland and Northern Ireland where available.
UK Company Insolvency Statistics 2026: Key Findings
- 1,946 company insolvencies were recorded in England and Wales in August 2026, compared with 2,007 in August 2025.
- 3,866 construction companies entered insolvency in the 12 months ending August 2026, the highest number among recorded industry sectors.
- 3,395 insolvencies occurred in wholesale and retail trade, followed by 3,201 in accommodation and food service activities.
- 50.1 per 10,000 registered companies was the rolling 12-month company insolvency rate in England and Wales to August 2026, down from 52.5 a year earlier.
- 268 insolvencies per 10,000 businesses was the annual business insolvency rate in accommodation and food services in 2025, the highest among major sectors.
- 269 per 10,000 businesses was the 2025 insolvency rate among businesses employing 20–49 people, the highest employee-size category.
- 143 per 10,000 businesses was the 2025 insolvency rate in the North East, the highest regional rate in England and Wales.
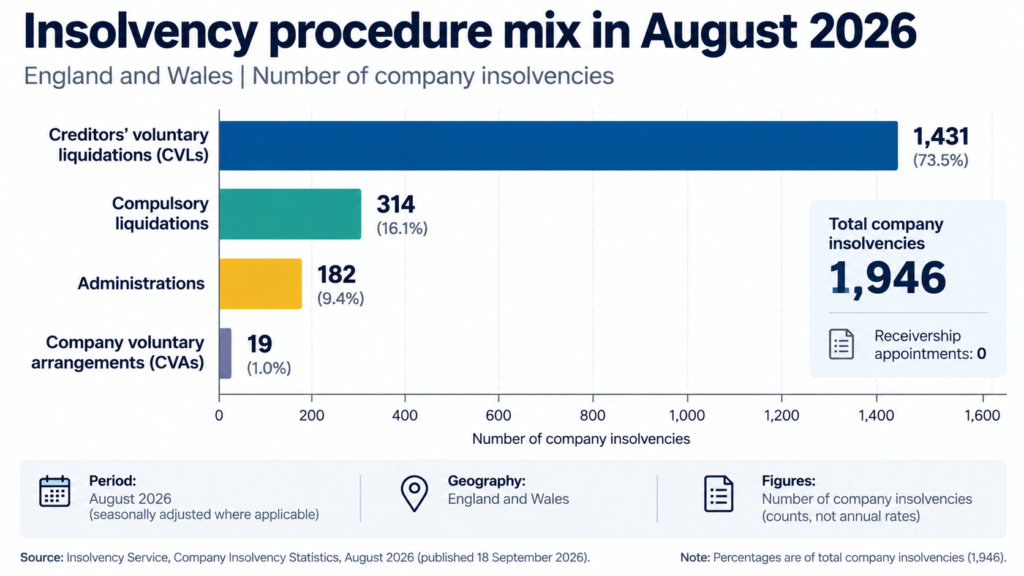
- 73.5% of August 2026 insolvencies were creditors’ voluntary liquidations, according to Audit Consulting Group’s calculation using official figures.
Sources: Insolvency Service, Company Insolvency Statistics August 2026 and Business Insolvency Demography 2015–2025.
Why two sector leaders appear in official data: Construction led the rolling company insolvency count to August 2026 (3,866). However, in the separate business insolvency demography series for calendar 2025, wholesale and retail trade had the largest number of business insolvencies (3,860), overtaking construction. These are different measures and periods, not contradictory rankings. Read the official 2025 industry commentary.
How Many UK Companies Have Become Insolvent in 2026?
The latest company insolvency data show that the number of formal insolvencies in England and Wales has remained substantial, although recent figures do not indicate an uninterrupted increase.
In August 2026, 1,946 companies entered insolvency, compared with 1,934 in July and 2,007 in August 2025. The Insolvency Service reported that monthly insolvency volumes during the first eight months of 2026 were slightly below the average recorded over the preceding three years.
| Period | Company insolvencies | Comparison |
|---|---|---|
| August 2025 | 2,007 | Previous-year reference |
| July 2026 | 1,934 | Previous month |
| August 2026 | 1,946 | Approximately 3% below August 2025 |
Source: Insolvency Service, August 2026 monthly release. The figures are from the seasonally adjusted monthly series.
The August year-on-year difference amounts to 61 fewer insolvencies. Audit Consulting Group calculates a decline of approximately 3.0%, using the published totals.
One month’s movement should not be mistaken for a lasting change in business conditions. Insolvency figures fluctuate with the timing of company registrations, liquidation proceedings and other administrative factors.
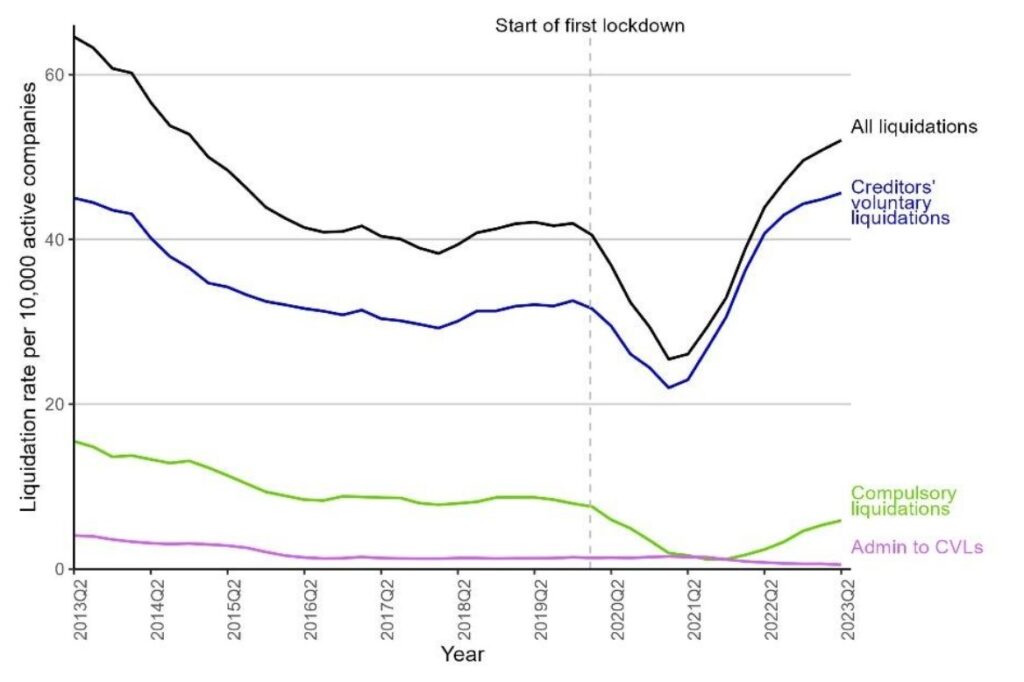
The Company Insolvency Rate Has Fallen, but Remains Above Pandemic Lows
The rolling annual company insolvency rate provides a broader perspective than a single month’s total.
For the 12 months ending 31 August 2026, the rate was 50.1 insolvencies per 10,000 companies on the effective Companies House register. The equivalent rate a year earlier was 52.5.
Audit Consulting Group calculates that this represents a reduction of approximately 4.6% in the reported rate, or 2.4 fewer insolvencies per 10,000 registered companies.
| Period ending | Insolvencies per 10,000 registered companies |
|---|---|
| August 2025 | 52.5 |
| May 2026 | 50.9 |
| June 2026 | 50.5 |
| July 2026 | 50.3 |
| August 2026 | 50.1 |
Source: Insolvency Service, August 2026 statistical commentary, Table 2.
Although company insolvency volumes remain elevated by historical standards, the relative rate is considerably below the 113.1 insolvencies per 10,000 companies recorded around the 2008–09 recession. One important reason is that the number of companies on the register has more than doubled over the intervening period.
Which Industries Recorded the Most Company Insolvencies to August 2026?
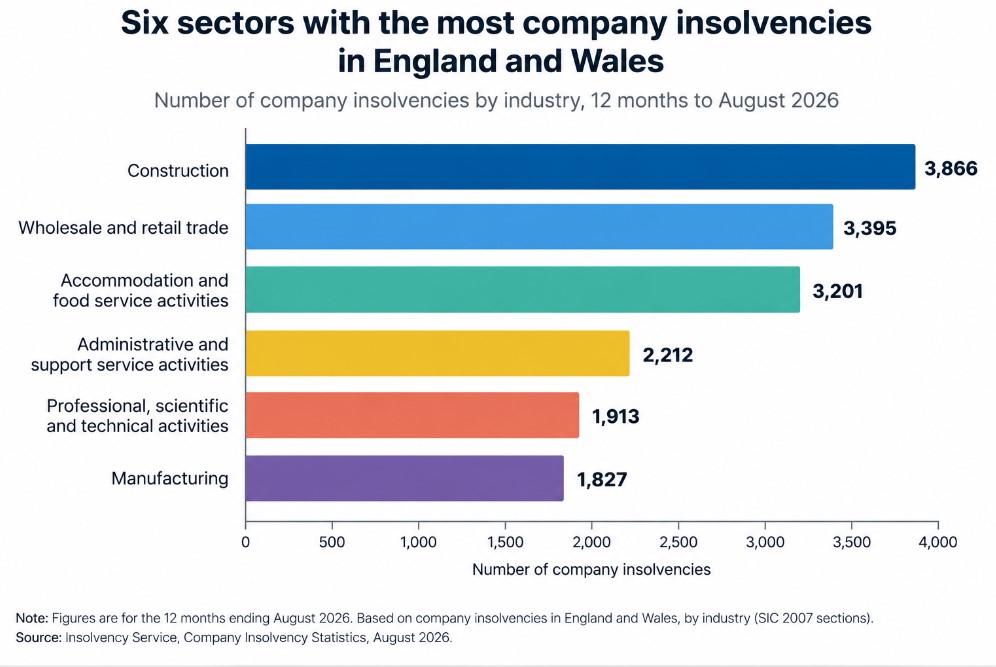
Construction continues to account for the largest number of formal company insolvencies in England and Wales. Wholesale and retail trade ranks second, followed closely by accommodation and food services.
The latest sector statistics cover the rolling 12-month period from September 2025 to August 2026. They therefore provide a more meaningful industry comparison than attempting to rank sectors using a single month.
| Rank | Industry | Insolvencies | Share of cases with industry recorded |
|---|---|---|---|
| 1 | Construction | 3,866 | 17% |
| 2 | Wholesale and retail trade; repair of motor vehicles and motorcycles | 3,395 | 15% |
| 3 | Accommodation and food service activities | 3,201 | 14% |
| 4 | Administrative and support service activities | 2,212 | 10% |
| 5 | Professional, scientific and technical activities | 1,913 | 8% |
| 6 | Manufacturing | 1,827 | 8% |
Source: Insolvency Service, Company Insolvency Statistics August 2026, industry breakdown using SIC 2007 classifications. Percentages are rounded official figures and exclude cases without a recorded trading industry. See accompanying data tables, Table 1c.
These six sectors account for a substantial proportion of recorded company insolvencies. Yet their rankings do not establish which businesses face the greatest probability of insolvency.
Larger sectors may contain more registered companies and consequently record more insolvencies even when their relative failure rates are lower.
The Insolvency Service also reports that insolvency numbers declined across most sectors compared with the preceding 12-month period. Among the six largest insolvency sectors, the reported decreases ranged from 2% in construction to 9% in wholesale and retail trade.
Which Industries Have the Highest Insolvency Rates?
The most revealing industry comparison emerges when the number of insolvencies is considered relative to the number of active businesses.
The Insolvency Service’s Business Insolvency Demography 2015–2025 publication provides this perspective. Unlike the monthly company insolvency statistics, it measures businesses that experienced company insolvency, using active businesses as the denominator.
In 2025, accommodation and food service activities recorded the highest business insolvency rate among major sectors: 268 insolvencies per 10,000 businesses.
The overall rate across England and Wales was 116 per 10,000 businesses. Among the nine largest sectors by business population, real estate activities had the lowest rate, at 60 per 10,000.
| Industry or comparison group | Insolvencies per 10,000 businesses |
|---|---|
| Accommodation and food service activities | 268 |
| Manufacturing | 167 |
| All businesses | 116 |
| Real estate activities | 60 |
Source: Insolvency Service, Business Insolvency Demography 2015–2025. Real estate is the lowest-rate sector among the nine largest industries considered in the official comparison. Manufacturing recorded 167 per 10,000, the second-highest rate among the nine largest industries. See official demographic tables.
Audit Consulting Group calculates that the hospitality insolvency rate was approximately 2.31 times the overall business rate and 4.47 times the real estate rate in 2025.
These ratios describe differences in recorded annual insolvency rates, not forecasts of future business failures.
Accommodation and food services has recorded the highest business insolvency rate in every year of the official series beginning in 2015. This makes the sector’s position more than a one-year anomaly.
Construction, Retail and Hospitality: Where Is Financial Pressure Concentrated?
Construction: The Largest Number of Company Insolvencies
Construction accounted for 3,866 company insolvencies in the 12 months to August 2026, representing approximately 17% of cases with a recorded industry.
The sector’s high volume makes it central to any analysis of UK business insolvency statistics. However, the number alone cannot establish whether a construction company is more likely to fail than a company operating in hospitality or another sector.
Construction businesses may be exposed to risks involving project cash flow, delayed payments, subcontractor obligations, financing costs and variations in demand. These are relevant financial risk mechanisms, but the published insolvency count does not establish which factors caused the recorded failures. For sector-specific accounting considerations, see ACG’s property and construction accounting guidance.
For company directors, the distinction between profitability and liquidity is particularly relevant. A business may report profitable contracts while facing cash-flow difficulties if payments arrive after payroll, supplier or tax liabilities become due.
Reliable Reliable cash-flow forecasts, management accounts and monitoring of outstanding liabilities can help directors assess financial exposure before payment difficulties become acute.
Retail: High Insolvency Volumes Despite a Recent Decline
Wholesale and retail trade, including motor vehicle repair activities, recorded 3,395 company insolvencies in the rolling year to August 2026.
The Insolvency Service reported a 9% reduction in insolvencies for this sector compared with the preceding 12 months, the largest percentage decline among the six highest-volume sectors.
This illustrates why a high absolute number should not automatically be described as evidence of accelerating deterioration.
Retailers face financial considerations involving stock, supplier terms, operating costs, consumer demand and working capital. Their individual circumstances vary substantially, and the insolvency data do not identify a single explanation for sector-wide outcomes. ACG also covers accounting for retail and wholesale businesses.
Hospitality: The Highest Relative Business Insolvency Rate
Accommodation and food services recorded 3,201 company insolvencies in the rolling year to August 2026, making it the third-largest sector by volume.
Its position becomes more significant when the latest annual business insolvency rates are examined. In 2025, the sector recorded 268 insolvencies per 10,000 businesses, more than twice the overall business rate.
The persistent nature of this difference deserves attention. The official demographic series shows hospitality leading the major sectors by insolvency rate throughout 2015–2025.
Labour costs, premises expenses, seasonal trading patterns and cash-flow management may be relevant to individual hospitality businesses. However, these potential pressures should not be presented as proven causes of the sector’s insolvency rate without separate supporting research. For related financial reporting considerations, see accounting services for hospitality businesses.
Manufacturing and Professional Services
Manufacturing recorded 1,827 company insolvencies in the 12 months to August 2026, while professional, scientific and technical activities recorded 1,913.
These sectors differ considerably in their operating models. Manufacturing may involve equipment investment, inventory and energy exposure, whereas professional service businesses often depend more heavily on personnel, client contracts and receivables.
Such differences are useful when interpreting financial vulnerability, but formal insolvency statistics alone cannot quantify the contribution of each operating cost or commercial pressure. ACG’s engineering and manufacturing accounting page covers sector-specific financial requirements.
How Have UK Company Insolvencies Changed Since 2019?
Recent insolvency trends need to be understood against the exceptional conditions surrounding the COVID-19 pandemic and the subsequent recovery in formal insolvency activity.
The Insolvency Service reports that company insolvencies fell to unusually low levels during 2020 and 2021, when government support measures and restrictions affecting creditor action were in place.
Creditors’ voluntary liquidations increased sharply in 2022, followed by further growth in 2023. Company insolvency volumes reached a 30-year high in 2023, with CVLs at a record level.
The subsequent picture is more mixed. The latest figures show a reduction in the rolling insolvency rate and lower insolvency volumes in most major sectors, although some types of formal insolvency have increased.
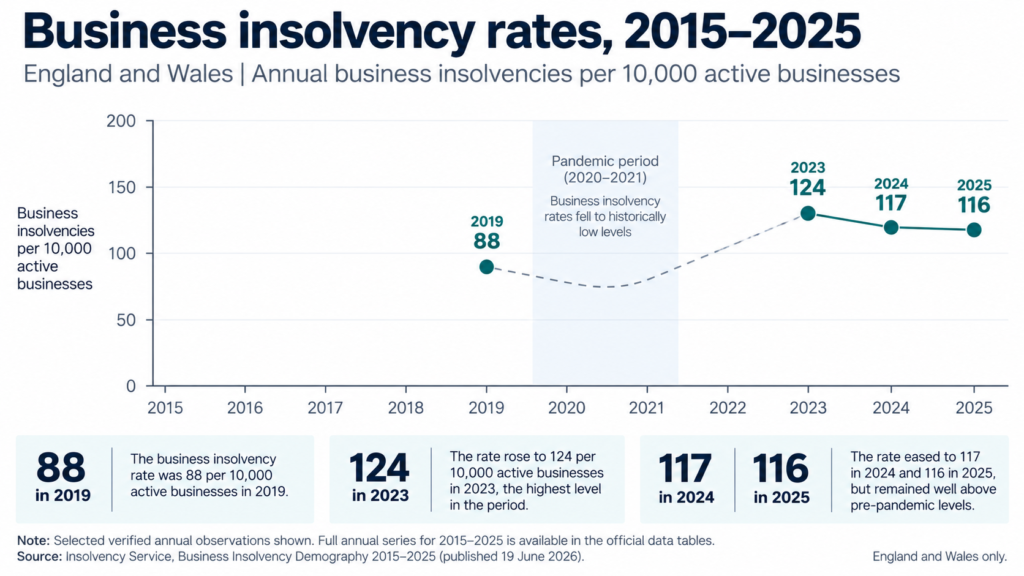
| Year | Business insolvencies per 10,000 businesses | Context |
|---|---|---|
| 2019 | 88 | Pre-pandemic reference |
| 2023 | 124 | Elevated post-pandemic insolvency period |
| 2024 | 117 | Lower than 2023 |
| 2025 | 116 | Broadly similar to 2024 |
Source: Insolvency Service, Business Insolvency Demography 2015–2025. Selected years are shown; this is not a complete annual time series.
The annual business insolvency rate in 2025 was lower than its 2023 level but remained higher than in 2019.
Audit Consulting Group calculates that the rate increased by approximately 31.8% between 2019 and 2025, based on the published rates of 88 and 116 per 10,000 businesses.
This longer-term comparison suggests that the recent easing in insolvency rates should not be confused with a complete return to pre-pandemic conditions.
Company Insolvency Types: Liquidations and Administrations in 2026
Different insolvency procedures serve different purposes. A rise in one procedure does not necessarily imply an equivalent increase across all forms of financial distress.
In August 2026, creditors’ voluntary liquidations accounted for most formal company insolvencies in England and Wales.
| Procedure | Number | Share of total (ACG calculation) |
|---|---|---|
| Creditors’ voluntary liquidations (CVLs) | 1,431 | 73.5% |
| Compulsory liquidations | 314 | 16.1% |
| Administrations | 182 | 9.4% |
| Company voluntary arrangements (CVAs) | 19 | 1.0% |
| Receivership appointments | 0 | 0.0% |
| Total | 1,946 | 100.0% |
Source: Insolvency Service, August 2026. Percentages calculated by Audit Consulting Group from published counts and rounded to one decimal place.
Creditors’ Voluntary Liquidations Remain the Dominant Procedure
A creditors’ voluntary liquidation is a formal process through which an insolvent company is wound up voluntarily, with a licensed insolvency practitioner appointed as liquidator.
CVLs represented approximately three-quarters of company insolvencies in August 2026. However, their number was 9% lower than in August 2025.
The average monthly number of CVLs during the first eight months of 2026 was also 7% lower than the monthly average for 2025.
Administrations Increased, but the Figures Need Context
Administrations reached 182 in August 2026, an increase of 60% compared with August 2025.
At first glance, this might suggest a widespread increase in companies requiring formal rescue or restructuring procedures. The official commentary, however, identifies an important concentration effect.
More than 250 connected companies in the real estate sector entered administration between March and August 2026, contributing to unusual volatility in the monthly administration figures.
This means that the increase cannot safely be interpreted as evidence of an equally broad deterioration across unrelated UK businesses.
Administration may be used to seek the rescue of a company as a going concern or to achieve a better outcome for creditors than an immediate winding-up would provide. It does not necessarily mean that all business operations stop immediately.
Which Business Sizes Face the Highest Insolvency Risk?
Smaller businesses account for many insolvencies in absolute terms, but the highest relative rates are not necessarily found among the smallest employers.
The Insolvency Service’s demographic research found that businesses employing 20–49 people had the highest insolvency rate of any employee-size category in England and Wales in 2025.
| Employee-size category | Insolvencies per 10,000 businesses |
|---|---|
| 0–1 employees | 82 |
| Manufacturing | 167 |
| 20–49 employees | 269 |
Source: Insolvency Service, Business Insolvency Demography 2015–2025. These are selected categories, not a complete employee-size distribution.
Businesses with 20–49 employees had a recorded insolvency rate approximately 3.28 times that of businesses with 0–1 employees, based on Audit Consulting Group’s calculation.
Although businesses with 0–4 employees accounted for 60% of business insolvencies in 2025, they represented approximately 78% of active businesses with company legal status.
This difference demonstrates why the size of the underlying business population matters when interpreting insolvency statistics.
The data also indicate that businesses with annual turnover between £2 million and £5 million had the highest insolvency rate among turnover categories in 2025, at 189 per 10,000 businesses.
These findings do not establish that increasing staff numbers or turnover causes insolvency. They identify groups with different observed rates and invite further investigation into their financial and operational characteristics.
Are Established Businesses More Vulnerable Than Start-ups?
Business age adds another dimension to the insolvency picture.
In England and Wales in 2025, businesses aged 7–10 years recorded the highest insolvency rate, at 170 per 10,000 businesses. Businesses younger than two years had the lowest rate, at 37.
| Business age | Insolvencies per 10,000 businesses |
|---|---|
| Less than 2 years | 37 |
| 7–10 years | 170 |
Source: Insolvency Service, Business Insolvency Demography 2015–2025.
Audit Consulting Group calculates that the rate among businesses aged 7–10 years was approximately 4.59 times the rate among businesses younger than two years.
That does not mean newer businesses are inherently safer. The measure concerns formal insolvency among businesses within the statistical population, rather than every possible form of business closure.
A young business that stops trading without entering a formal company insolvency procedure may not appear in these statistics.
The finding nevertheless challenges the assumption that formal insolvency risk is concentrated exclusively in the earliest years of trading.
Which Regions of England and Wales Had the Highest Insolvency Rates?
Regional insolvency statistics reveal persistent differences across England and Wales.
In 2025, the North East recorded the highest business insolvency rate, at 143 per 10,000 businesses. The South West recorded the lowest, at 105.
The Insolvency Service reports that the North East has held the highest regional rate since 2021, while the South West has recorded the lowest over the same period.
| Region or area | Insolvencies per 10,000 businesses |
|---|---|
| North East | 143 |
| England and Wales overall | 116 |
| South West | 105 |
Source: Insolvency Service, Business Insolvency Demography 2015–2025.
Audit Consulting Group calculates that the North East’s rate was approximately 36.2% higher than the South West’s rate.
Regional comparisons also differ by insolvency procedure. In 2025, the North East had the highest CVL rate, London the highest compulsory liquidation rate and the North West the highest administration rate.
The geographic data use business registration information, which may reflect a head office rather than every location where the business operates.
These findings should therefore not be interpreted as a precise measure of where affected employees, customers or suppliers are located.
Scotland and Northern Ireland: Separate Insolvency Statistics
The August 2026 Insolvency Service release also provides figures for Scotland and Northern Ireland.
Scotland recorded 73 company insolvencies during August 2026, while Northern Ireland recorded seven. Both totals were below the corresponding figures in August 2025.
Scotland’s rolling 12-month company insolvency rate was 48.5 per 10,000 registered companies in August 2026.
However, insolvency law, registration arrangements and statistical presentation differ across UK jurisdictions. Consequently, the England and Wales sector rankings should not be described as a verified ranking for the whole United Kingdom.
A complete UK-wide industry comparison would require the corresponding sector data for Scotland and Northern Ireland to be extracted and assessed on a consistent basis.
What Do the Insolvency Statistics Mean for UK Businesses?
Insolvency statistics describe companies that have already entered formal procedures. They do not directly measure every business experiencing financial pressure.
A company may face declining margins, late customer payments or difficulties meeting liabilities without appearing in the official insolvency figures. Equally, a company may close voluntarily while remaining solvent.
For directors and finance teams, the findings point towards the importance of assessing financial exposure using company-specific information rather than relying solely on industry averages.
Cash Flow Can Tell a Different Story from Profit
Profitability and cash availability are related but distinct. A business may generate accounting profits while struggling to meet short-term commitments because money remains tied up in receivables, stock or unfinished work. Consistent small business bookkeeping helps keep the underlying records up to date.
Regular cash-flow forecasting and timely management accounts can provide a clearer picture of whether expected receipts are sufficient to meet upcoming obligations.
Tax and Creditor Liabilities Need Accurate Monitoring
For businesses experiencing financial difficulty, accurate records of outstanding VAT, PAYE, Corporation Tax and other liabilities are relevant to understanding the overall creditor position.
Directors should distinguish between temporary cash-flow pressures and circumstances in which a company may be unable to pay its debts as they fall due. The legal implications depend on the company’s circumstances and require appropriate professional advice.
Industry Statistics Are Context, Not a Company-Level Prediction
A high insolvency rate in hospitality does not mean that an individual restaurant will become insolvent. Nor does a lower sector rate guarantee that a particular business is financially secure.
Company-specific factors such as liquidity, debt obligations, customer concentration, contract terms and financial controls remain relevant.
The practical value of sector statistics is to provide context for financial planning, benchmarking and risk assessment, rather than a substitute for examining an individual company’s accounts.
Research Methodology: How Audit Consulting Group Analysed the Data
This article draws primarily on two publications from the UK Insolvency Service:
- Company Insolvencies, August 2026, published on 18 September 2026.
- Business Insolvency Demography, 2015 to 2025, published on 19 June 2026.
Research cut-off date: 15 October 2026.
Geographic scope: England and Wales for the principal industry, demographic and regional comparisons. Scotland and Northern Ireland are discussed separately where relevant.
Reporting periods: August 2026 for the latest monthly company insolvency figures; September 2025–August 2026 for the rolling industry totals; calendar year 2025 for the latest annual business insolvency rates.
Company Insolvencies and Business Insolvencies Are Different Measures
The monthly Company Insolvency Statistics count registered companies entering formal insolvency procedures. Their rolling rates use companies on the effective Companies House register as the denominator.
Business Insolvency Demography uses a different statistical population. It identifies businesses that have experienced at least one constituent company entering insolvency and uses active businesses with company legal status as the denominator.
One business may consist of more than one registered company. This explains why the two publications can report different insolvency counts and rates without being contradictory.
For example, the demographic publication reported 22,455 business insolvencies in England and Wales in 2025, while 23,942 registered companies entered insolvency during that year.
The business insolvency rate of 116 per 10,000 in 2025 is therefore not directly comparable with the rolling company insolvency rate of 50.1 per 10,000 registered companies to August 2026.
Industry Classification and Data Limitations
The monthly industry analysis uses Standard Industrial Classification (SIC 2007) information recorded at Companies House. SIC codes are self-reported, and the first recorded code is used for the industry breakdown.
The industry breakdown is based on the first self-reported SIC 2007 code recorded at Companies House. Cases with unknown industry are excluded from the sector share denominator; recent classifications may be revised. The demographic publication separately matches company insolvency records to active businesses on the Inter-Departmental Business Register, and unmatched cases are excluded from relevant breakdowns.
Recent sector figures may be revised as additional classification information becomes available.
The Business Insolvency Demography publication is classified as official statistics in development. Its methodology matches company insolvency records with business information from the Inter-Departmental Business Register. Unmatched cases are excluded from relevant totals and breakdowns, which may lead to some underestimation.
Audit Consulting Group Calculations
Where this article presents original calculations, Audit Consulting Group has used the published official figures without substituting estimates for missing observations.
Percentage changes are calculated as the difference between the new and previous values divided by the previous value, multiplied by 100.
Relative-rate comparisons divide one published insolvency rate by another rate from the same statistical series and reference year.
Results are rounded for readability. Calculations using already-rounded published rates may differ slightly from calculations based on unrounded source data.
These comparisons are descriptive. They do not establish causation, predict future insolvencies or represent personalised financial or legal advice.
What the Next Insolvency Statistics Will Need to Clarify
The latest evidence presents a more nuanced picture than a simple narrative of rising business failures.
Construction continues to record the greatest number of company insolvencies, while accommodation and food services shows the highest relative insolvency rate in the latest detailed annual sector research. Meanwhile, the overall rolling company insolvency rate has declined compared with a year earlier, even as administrations have risen sharply in recent months.
For UK businesses, the central finding is that financial pressure is unevenly distributed. Industry, business size, age, region and insolvency procedure each reveal different aspects of the picture.
The next monthly Insolvency Service release is scheduled for 20 October 2026. Further publications will help establish whether the recent easing in company insolvency rates continues and whether changes in particular sectors represent persistent trends or temporary fluctuations.
Until then, the available evidence supports a clear distinction: the industries with the most insolvencies are not necessarily those with the highest relative insolvency risk.
About the Author
Iryna Shmulenko is a qualified accountant and auditor with strong experience in finance, internal audit, and accounting systems. She previously built and supervised complete accounting and control frameworks for various companies across multiple countries. As one of the founders of Audit Consulting Group (UK), she provides accounting, tax, VAT, payroll, and internal audit services to UK and international clients. Iryna combines global audit standards with modern UK practices to create efficient and transparent financial processes. She is ACCA partly qualified and specialises in tax advisory, financial audit, internal controls, and business process optimisation.