
United Kingdom Taxation Trends and Public Sector Receipts: Fiscal Years 2000–2024, with a 2025–2030 Outlook
Research Report by Audit Consulting Group
Prepared by Audit Consulting Group, London
This research report analyses the evolution of UK public sector receipts from financial year 2000 to financial year 2024, with a forward-looking outlook for 2025–2030. It focuses on the major revenue components of the UK fiscal system, including PAYE Income Tax, Self Assessment, Corporation Tax, Value Added Tax (VAT), and National Insurance Contributions (NICs).
The report is based on official public finance data from the Office for National Statistics (ONS), HM Revenue & Customs (HMRC), and macroeconomic context from the Office for Budget Responsibility (OBR). The 2025–2030 section represents Audit Consulting Group’s scenario-based outlook and should be read as an analytical projection rather than an official government forecast.
Explore our Advisory Services for expert support with taxation trends, public finance analysis, business planning, and strategic tax advisory in the UK.
Executive Summary
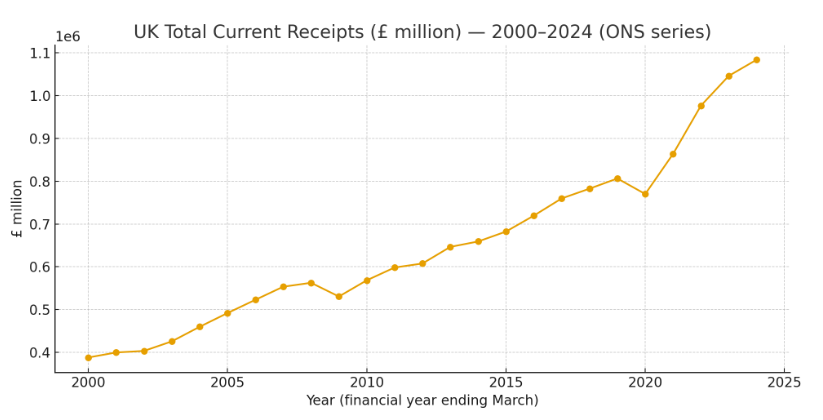
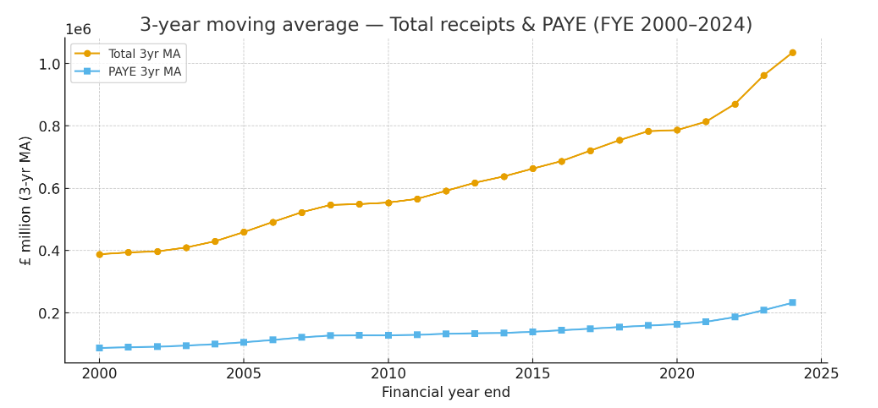
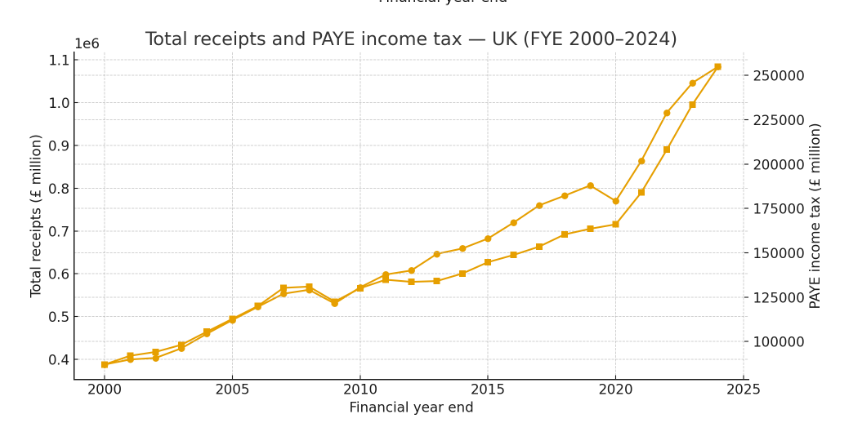
Over the past quarter-century, the United Kingdom’s tax system has shown significant resilience. Total public sector receipts increased from approximately £387.9 billion in FY2000 to more than £1.08 trillion in FY2024, reflecting growth in employment, wages, consumption, company profits, and digitalised tax administration.
Across this period, the UK experienced several major fiscal phases:
- the pre-financial-crisis expansion from 2000 to 2007;
- the 2008–2010 financial crisis and recovery period;
- the fiscal consolidation phase from 2011 to 2019;
- the COVID-19 economic shock and post-pandemic rebound from 2020 to 2024.
Several structural trends stand out:
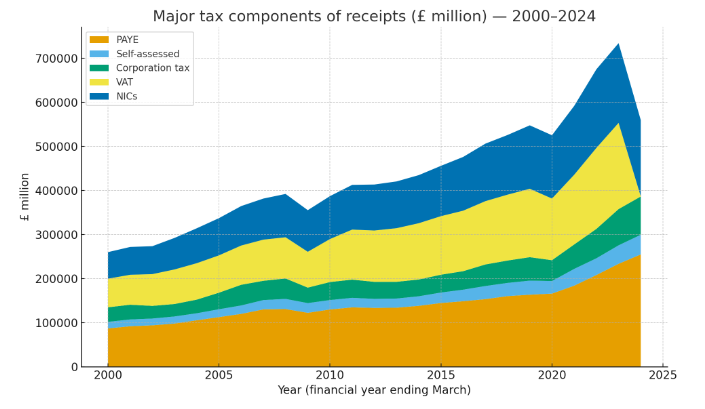
- PAYE Income Tax and NICs remained the most stable revenue base, supported by employment and wage growth.
- Corporation Tax was more cyclical, falling during crises but recovering strongly after 2020.
- VAT proved resilient because of its broad consumption base.
- Self Assessment receipts remained smaller but more sensitive to private wealth, investment income, self-employment, and capital gains.
- The overall receipts-to-GDP ratio remained broadly stable, showing the durability of the UK fiscal model.
The overall conclusion is that the UK tax system is cyclical, but not fragile. Its strength lies in a diversified revenue base, strong administrative institutions, and the ability to adapt after economic shocks.
Methodology and Data Sources
The analysis uses financial year data, running from April to March, and focuses on nominal public sector receipts in current prices. The main sources are ONS Public Sector Finances, HMRC tax receipts statistics, ONS national accounts data, and OBR economic and fiscal outlook material.
Data Scope
- Period covered: financial years ending 2000 to 2024
- Units: £ million, current prices
- Primary sources: ONS Public Sector Finances, HMRC receipts statistics, ONS GDP datasets, and OBR fiscal outlooks
- Main components analysed: PAYE Income Tax, Self Assessment, Corporation Tax, VAT, NICs, and total public sector receipts
Analytical Metrics
- Nominal receipt levels
- Year-on-year growth rates
- Receipts as a percentage of GDP
- Component shares of total receipts
- Long-term trend and cyclical sensitivity analysis
Official Data Sources Used
| Dataset | Series / Category | Description | Source |
|---|---|---|---|
| Total Current Receipts | Public sector current receipts | Overall tax and non-tax public sector income | ONS Public Sector Finances |
| PAYE Income Tax | PAYE receipts | Income tax collected through employer payroll systems | ONS / HMRC |
| Self Assessment | SA Income Tax and related receipts | Income from self-employed taxpayers, landlords, partnerships, dividends and capital gains | ONS / HMRC |
| Corporation Tax | Corporation Tax receipts | Tax on company profits | ONS / HMRC |
| Value Added Tax | VAT receipts | Consumption-based indirect tax | ONS / HMRC |
| National Insurance Contributions | NICs | Employee, employer and self-employed contributions | ONS / HMRC |
| GDP | Current price GDP | Used for receipts-to-GDP analysis | ONS National Accounts |
Macroeconomic Context: 2000–2024
The period from FY2000 to FY2024 covers some of the most important economic events in modern UK fiscal history. Tax receipts were shaped by growth cycles, financial instability, austerity, inflation, employment trends, digitalisation, and major policy reforms.
The Early 2000s: Stability and Expansion
The early 2000s were marked by relatively strong GDP growth, stable inflation, rising employment, and high consumer confidence. Public sector receipts grew steadily as the labour market expanded and consumption remained strong.
During this period:
- PAYE receipts increased as employment and wages grew;
- VAT benefited from strong household consumption;
- Corporation Tax receipts were supported by profitability in financial services, energy, and corporate sectors;
- NICs rose alongside employment and wage growth.
By FY2007, total receipts had reached more than £553 billion, compared with approximately £388 billion in FY2000.
The Financial Crisis and Its Aftermath
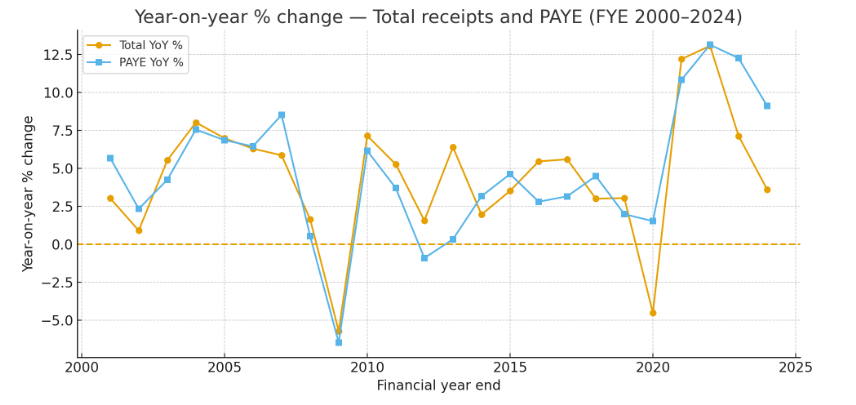
The 2008 global financial crisis interrupted the UK’s fiscal expansion. Corporate profitability weakened, unemployment rose, and public borrowing increased sharply.
The crisis affected receipts unevenly:
- Corporation Tax receipts fell sharply as business profits declined;
- PAYE and NICs were affected by weaker employment and wage growth;
- VAT receipts fell during the downturn, partly affected by the temporary VAT rate reduction;
- public borrowing increased as the government supported the financial system and wider economy.
Despite this shock, the tax system retained structural stability. Receipts recovered gradually from 2010 onwards.
Fiscal Consolidation and Recovery: 2013–2019
From 2013 to 2019, the UK experienced a period of gradual fiscal repair. Employment rose, unemployment fell, and tax receipts increased despite reductions in the headline Corporation Tax rate.
Key trends included:
- PAYE receipts increased as employment expanded;
- NICs grew in line with labour market strength;
- VAT receipts rose steadily with consumption;
- Corporation Tax receipts improved as profitability recovered and compliance measures strengthened.
By FY2019, total receipts exceeded £806 billion, reflecting a stronger and broader tax base than in the immediate post-crisis period.
The Pandemic Shock and Rebound: 2020–2024
The COVID-19 pandemic caused one of the sharpest economic contractions in modern UK history. Lockdowns affected consumption, corporate profits, employment, and public spending.
However, tax receipts recovered strongly after the initial shock. Government support measures, wage protection schemes, inflation, and the recovery in consumption helped receipts rebound from FY2021 onwards.
By FY2024, total public sector receipts reached more than £1.08 trillion, marking a major nominal increase compared with pre-pandemic levels.
UK Public Sector Receipts and Major Tax Components: FY2000–FY2024
The following table summarises total receipts and selected major tax components across the period.
| Year | Total Receipts (£m) | PAYE (£m) | Self Assessment (£m) | Corporation Tax (£m) | VAT (£m) | NICs (£m) |
|---|---|---|---|---|---|---|
| 2000 | 387,881 | 87,018 | 14,921 | 33,002 | 64,918 | 60,252 |
| 2001 | 399,647 | 91,960 | 15,387 | 33,482 | 67,908 | 63,125 |
| 2002 | 403,283 | 94,109 | 15,323 | 28,732 | 72,048 | 63,410 |
| 2003 | 425,579 | 98,106 | 16,033 | 28,312 | 78,391 | 71,540 |
| 2004 | 459,696 | 105,513 | 15,917 | 30,936 | 82,666 | 79,224 |
| 2005 | 491,783 | 112,742 | 17,773 | 37,641 | 84,630 | 84,459 |
| 2006 | 522,725 | 120,011 | 19,083 | 46,948 | 89,014 | 89,550 |
| 2007 | 553,348 | 130,228 | 21,107 | 43,766 | 93,348 | 93,210 |
| 2008 | 562,508 | 130,934 | 23,033 | 46,423 | 93,419 | 98,319 |
| 2009 | 530,451 | 122,482 | 21,973 | 35,157 | 81,262 | 94,445 |
| 2010 | 568,317 | 130,019 | 21,374 | 40,893 | 97,565 | 97,346 |
| 2011 | 598,230 | 134,827 | 21,582 | 41,381 | 113,461 | 101,441 |
| 2012 | 607,604 | 133,614 | 20,445 | 38,656 | 116,459 | 104,319 |
| 2013 | 646,435 | 134,062 | 20,740 | 37,987 | 121,650 | 106,085 |
| 2014 | 659,090 | 138,308 | 21,621 | 38,147 | 127,647 | 109,120 |
| 2015 | 682,272 | 144,703 | 23,756 | 40,493 | 132,790 | 114,173 |
| 2016 | 719,489 | 148,761 | 26,134 | 42,024 | 137,215 | 121,963 |
| 2017 | 759,725 | 153,457 | 29,751 | 48,920 | 143,636 | 130,449 |
| 2018 | 782,552 | 160,354 | 29,916 | 50,796 | 149,454 | 135,378 |
| 2019 | 806,354 | 163,535 | 31,913 | 53,240 | 155,148 | 143,952 |
| 2020 | 770,010 | 166,031 | 28,469 | 47,298 | 139,872 | 143,608 |
| 2021 | 863,814 | 183,988 | 38,068 | 55,435 | 158,121 | 156,208 |
| 2022 | 976,584 | 208,140 | 37,973 | 66,722 | 183,614 | 178,440 |
| 2023 | 1,046,203 | 233,623 | 41,912 | 82,225 | 195,579 | 180,921 |
| 2024 | 1,083,899 | 254,881 | 44,619 | 86,884 | NA | 173,276 |
Note: Values are shown in £ million and rounded where appropriate. VAT data for FY2024 was not available in the extracted VAT series used in the original dataset, so the cell is shown as NA rather than estimated.
Component Analysis: The Main Pillars of UK Tax Receipts
The UK’s public sector receipts are supported by several major tax streams. Each reflects a different part of the economy: labour income, self-employment, company profits, consumption, and social insurance contributions.
PAYE Income Tax: The Core Engine of Fiscal Stability
PAYE Income Tax is one of the most stable and predictable revenue sources in the UK fiscal system. It is collected through employer payroll systems and closely reflects employment levels, earnings growth, and the structure of the labour market.
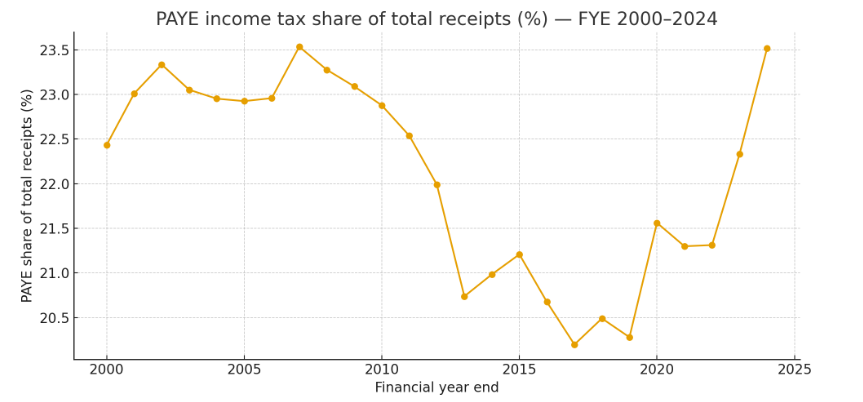
Between FY2000 and FY2024, PAYE receipts increased from approximately £87 billion to nearly £255 billion. This growth was driven by employment expansion, nominal wage growth, fiscal drag, and improved payroll reporting systems.
Key Drivers of PAYE Growth
- Employment growth: a larger workforce increased the tax base.
- Nominal wage growth: higher earnings increased taxable income.
- Fiscal drag: frozen or slowly adjusted thresholds increased the effective tax take over time.
- Digitalisation: Real Time Information improved payroll reporting and tax collection accuracy.
PAYE proved relatively resilient during downturns. Even during the financial crisis and pandemic, receipts did not collapse in the same way as more profit-sensitive taxes.
Self Assessment Income Tax: A More Volatile Revenue Stream
Self Assessment receipts include income from self-employment, partnership income, property income, dividends, capital gains, and other non-PAYE sources. This makes the category more sensitive to market cycles, business income, investment activity, and property trends.
Self Assessment receipts increased from approximately £14.9 billion in FY2000 to £44.6 billion in FY2024. Growth was supported by the expansion of self-employment, higher property income, dividend income, and investment-related taxable gains.
Why Self Assessment Is More Volatile
- self-employed income can fluctuate significantly year to year;
- capital gains depend on asset markets;
- property income is affected by interest rates and landlord regulation;
- dividend income responds to business profitability and tax rules;
- payment timing can distort annual receipts.
Although smaller than PAYE, Self Assessment is an important indicator of private wealth, entrepreneurial income, and investment confidence.
Corporation Tax: A Barometer of Business Profitability
Corporation Tax reflects taxable company profits and is one of the most cyclical components of the UK revenue system. It is strongly affected by profitability, rate changes, investment allowances, sector performance, and anti-avoidance policy.
Corporation Tax receipts increased from approximately £33 billion in FY2000 to £86.9 billion in FY2024. However, this growth was not linear. Receipts fell sharply during the financial crisis and again during the pandemic before recovering strongly.
Key Corporation Tax Trends
- Receipts were strong before the 2008 financial crisis due to profitability in financial services, energy, and corporate sectors.
- The financial crisis caused a sharp fall in profits and receipts.
- The 2010s saw rate reductions but stronger compliance and a broader profit base.
- Post-pandemic receipts increased significantly, supported by profit recovery and the rise in the main Corporation Tax rate for larger companies.
Corporation Tax remains strategically important but inherently volatile. It provides insight into business health, investment conditions, and sector concentration in the UK economy.
Value Added Tax: The Pillar of Consumption-Based Revenue
VAT is one of the UK’s most important indirect taxes. It applies to most goods and services and is closely linked to consumer spending, inflation, imports, and business activity.
VAT receipts grew from approximately £64.9 billion in FY2000 to approximately £195.6 billion in FY2023. Growth was supported by nominal consumption, the 20% standard rate, digital commerce, and stronger compliance systems.
Key VAT Developments
- VAT receipts grew steadily during the early 2000s.
- The temporary VAT cut during the financial crisis reduced receipts in the short term.
- The move to a 20% standard rate became a major structural revenue source.
- Online retail and digital services broadened the consumption tax base.
- Making Tax Digital strengthened VAT reporting and compliance.
VAT is sensitive to consumption cycles but benefits from a broad base. It remains one of the most important stabilisers in the UK revenue mix.
National Insurance Contributions: The Link Between Work and Welfare
National Insurance Contributions are closely tied to employment, wages, and social security funding. NICs operate as both a labour tax and a contribution mechanism linked to state pension and welfare entitlements.
NIC receipts increased from approximately £60.3 billion in FY2000 to £173.3 billion in FY2024. This reflects employment growth, wage growth, employer contributions, and policy changes affecting thresholds and rates.
Key NICs Drivers
- higher employment levels;
- nominal wage growth;
- employer contribution growth;
- policy changes to thresholds and rates;
- resilience of payroll employment during the pandemic due to wage support schemes.
NICs remain one of the largest and most stable components of UK public sector receipts.
Summary of Major Tax Component Trends
| Component | FY2000 | FY2024 | Approximate Change | Interpretation |
|---|---|---|---|---|
| PAYE Income Tax | £87.0bn | £254.9bn | +193% | Stable, employment-driven growth |
| Self Assessment | £14.9bn | £44.6bn | +199% | Volatile, linked to self-employment, dividends, property and gains |
| Corporation Tax | £33.0bn | £86.9bn | +163% | Cyclical, profit-sensitive and policy-sensitive |
| VAT | £64.9bn | £195.6bn by FY2023 | Approximately +200% | Broad consumption-based revenue source |
| NICs | £60.3bn | £173.3bn | +187% | Wage-linked and employment-driven |
Receipts as a Percentage of GDP
The ratio of public sector receipts to GDP is one of the most important measures of the overall tax burden. It shows how much of national income is collected through taxes, social contributions, and other public sector receipts.
From 2000 to 2024, the UK receipts-to-GDP ratio remained broadly within a range of approximately 34% to 38%. This stability is a key feature of the UK fiscal model.
Why the Ratio Has Remained Stable
- The UK tax base is diversified across income, consumption, profit, and employment taxes.
- PAYE and NICs provide a stable labour-based revenue foundation.
- VAT provides resilience through broad consumption coverage.
- Corporation Tax and Self Assessment add cyclical upside during growth periods.
- Digital administration has improved compliance and reporting accuracy.
| Fiscal Year | Receipts as % of GDP | Context |
|---|---|---|
| FY2000 | Approximately 35% | Stable pre-crisis expansion |
| FY2010 | Approximately 35% | Post-financial-crisis adjustment |
| FY2024 | Approximately 37%–38% | Post-pandemic rebound and stronger nominal receipts |
Interpretation of the UK Tax-to-GDP Ratio
The UK sits between lower-tax Anglo-American models and higher-tax continental European models. Its receipts-to-GDP ratio is lower than many European welfare-state economies but higher than the United States.
This reflects the UK’s policy balance: maintaining a competitive business environment while funding large public services such as the NHS, pensions, welfare, education, and infrastructure.
The stability of the ratio suggests that the UK fiscal framework has remained institutionally strong despite major shocks.
2025–2030 Fiscal Outlook
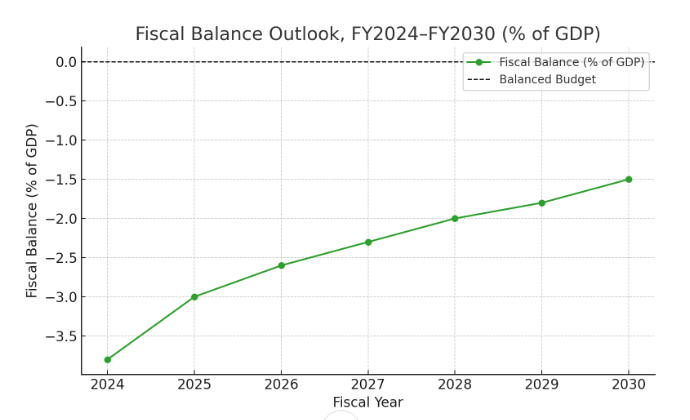
The outlook for 2025–2030 is shaped by several forces: moderate economic growth, higher debt servicing costs, population change, digital tax compliance, public spending pressure, and the need to maintain fiscal credibility.
This section represents Audit Consulting Group’s scenario-based assessment. It is not an official forecast, but it uses historical receipts behaviour, official macroeconomic context, and expected policy direction to estimate possible fiscal trends.
Baseline Assumptions
- Nominal GDP continues to grow moderately.
- Inflation gradually stabilises closer to target levels.
- Employment remains relatively resilient.
- PAYE, NICs and VAT remain the core revenue drivers.
- Corporation Tax remains sensitive to profit cycles and investment incentives.
- Making Tax Digital and data-driven HMRC compliance improve effective collection.
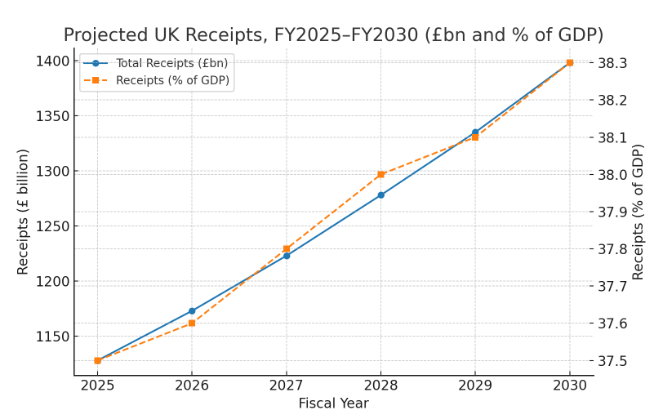
Projected Receipts: ACG Scenario Outlook
| Fiscal Year | Illustrative Total Receipts (£bn) | Receipts as % of GDP | Commentary |
|---|---|---|---|
| 2025 | 1,128 | 37.5% | Continuation of post-pandemic nominal growth |
| 2026 | 1,173 | 37.6% | PAYE and VAT remain resilient |
| 2027 | 1,223 | 37.8% | Moderate growth and stronger digital compliance |
| 2028 | 1,278 | 38.0% | Labour-market and consumption receipts remain central |
| 2029 | 1,335 | 38.1% | Gradual fiscal consolidation |
| 2030 | 1,398 | 38.3% | Receipts broadly aligned with trend nominal GDP growth |
Important note: These figures are ACG scenario estimates for analytical purposes. Actual results will depend on growth, inflation, tax policy, public spending, labour market performance, and future OBR forecasts.
Expected Composition Trends: 2025–2030
| Component | 2024 Position | 2030 Direction | Key Driver |
|---|---|---|---|
| PAYE Income Tax | Large and stable | Likely to increase | Wage growth and fiscal drag |
| Self Assessment | Smaller but volatile | Broadly stable | Self-employment, dividends, property and capital gains |
| Corporation Tax | Strong post-pandemic recovery | Potentially volatile | Profit cycles, investment reliefs and global tax reforms |
| VAT | Major indirect tax source | Likely to remain resilient | Consumption, inflation and digital commerce |
| NICs | Large labour-based receipts | Likely to remain important | Employment, wages and employer contributions |
Key Fiscal Risks for 2025–2030
1. Slower Economic Growth
If real GDP growth remains weak, tax receipts may grow more slowly than expected. This would particularly affect Corporation Tax, VAT, and Self Assessment receipts.
2. Higher Debt Servicing Costs
Even if receipts remain strong, elevated interest costs can reduce fiscal flexibility and increase pressure on public spending decisions.
3. Corporate Profit Volatility
Corporation Tax receipts may be affected by global demand, investment cycles, financing costs, energy prices, and multinational tax reforms.
4. Labour Market Shifts
More flexible work, self-employment, international remote work, and demographic change may affect PAYE and NICs receipts over the medium term.
5. Consumption Pattern Changes
Changes in consumer behaviour, digital commerce, green transition policies, and reduced demand for some taxable goods may affect VAT and excise receipts.
Opportunities for Revenue Resilience
Digital Tax Administration
Making Tax Digital, better data matching, and improved HMRC compliance analytics may increase the effective tax take without large headline rate increases.
Green and Environmental Taxes
Carbon pricing, environmental levies, and sustainability-related fiscal tools may become more important as the UK moves toward net-zero targets.
Broader VAT and Digital Economy Coverage
As more economic activity moves online, digital services, platforms, and cross-border transactions may become a greater focus for indirect tax compliance.
AI-Driven Compliance Analytics
HMRC’s use of digital data and risk analysis is likely to strengthen compliance checks across VAT, Corporation Tax, PAYE, and Self Assessment.
Alternative Fiscal Scenarios
| Scenario | Economic Conditions | Receipts-to-GDP by 2030 | Fiscal Interpretation |
|---|---|---|---|
| Optimistic | Stronger productivity, investment and real wage growth | Approximately 38.5% | Higher receipts and improved fiscal headroom |
| Baseline | Moderate growth and stable employment | Approximately 38.3% | Steady consolidation and fiscal resilience |
| Conservative | Weak productivity and slower nominal growth | Approximately 37.5% | More pressure on borrowing and public spending |
Strategic Implications for UK Businesses
For businesses, taxation trends are not just a matter of public finance. They affect cash flow, compliance obligations, planning decisions, investment strategy, and future tax exposure.
Several practical implications stand out:
- PAYE and payroll compliance will remain central for employers.
- VAT compliance and digital record-keeping will become increasingly important.
- Corporation Tax planning should account for rate changes, reliefs, and profit volatility.
- Self-employed individuals and landlords should prepare for Making Tax Digital.
- Businesses with international operations should monitor global tax reform and transfer pricing developments.
How Audit Consulting Group Supports Businesses
Audit Consulting Group supports UK businesses and individuals with practical tax, accounting, payroll, VAT, and advisory services.
Our services include:
- VAT advisory and compliance support;
- Corporation Tax planning and returns;
- PAYE and payroll services;
- Self Assessment support;
- Making Tax Digital implementation;
- management accounts and forecasting;
- business advisory and tax planning;
- HMRC compliance and enquiry support.
If your business needs help understanding taxation trends, planning future tax exposure, or strengthening compliance systems, our team can provide clear and practical support.
Conclusion
Between FY2000 and FY2024, the United Kingdom demonstrated substantial fiscal resilience. Total public sector receipts increased significantly in nominal terms, while the tax-to-GDP ratio remained relatively stable. This stability reflects a diversified tax structure, strong fiscal institutions, and continuous improvement in compliance systems.
The main lesson is clear: the UK tax system is highly exposed to economic cycles, but it has repeatedly shown the capacity to recover from shocks. PAYE, VAT and NICs provide structural stability, while Corporation Tax and Self Assessment add cyclical sensitivity.
Looking ahead to 2025–2030, the fiscal outlook is one of measured resilience. The key challenges will be growth, productivity, debt servicing costs, demographic pressure, and the need to fund public services without undermining competitiveness.
For businesses and taxpayers, the direction of travel is equally clear: digital compliance, accurate reporting, proactive tax planning, and strong advisory support will become even more important.
Appendix: Official Source Links
- ONS Public Sector Current Receipts: Appendix D
- HMRC Tax Receipts and National Insurance Contributions
- OBR Economic and Fiscal Outlook
Audit Consulting Group – Accounting and Tax
Email: info@auditconsultinggroup.co.uk
Website: auditconsultinggroup.co.uk